Model & Display Setup#
Some examples require external input files. Before you start, please follow the link in the Example Scripts section to download the zip file with model and result files.
Example 01 - Planar and Spherical Section Cuts#
At the beginning of the script the combination of data types and associated four components the user wants to analyze are specified in a dictionary. The code than loops over all data types and creates one page per data type with a four window layout for each component. A spherical section cut will be positioned at the maximum scalar result.
The code runs through the following steps: The pages are created with the Page class, the title is set according to the data type. In each window the model will be loaded via the Window class using the addModelAndResult() method.
The scalar results are loaded using the ResultDefinitionScalar class. The maximum values are found using a collection via the Collection class and the addByFilter() method. If the entity binding is of type element the center of the section cut is the centroid of the element, queried with centroid attribute of the element object.
The section cuts are added add the base coordinates using the SectionCutSpherical class with a given radius, feature lines and transparency turned on.
 1import hw
 2import hw.hv as hv
 3import os
 4
 5ses = hw.Session()
 6ses.new()
 7
 8scriptDir = os.path.abspath(os.path.dirname(__file__))
 9modelFile = os.path.join(scriptDir, "aerobox", "aerobox.fem")
10resultFile = os.path.join(scriptDir, "aerobox", "aerobox-LC1-2.op2")
11
12# Dictionary with dataType dependent result scalar settings
13resDict = {
14    "Displacement": ["Mag", "X", "Y", "Z"],
15    "Stress": ["vonMises", "MaxShear", "In-plane P1 (major)", "In-plane P2 (minor)"],
16}
17
18# Change window type
19ses.get(hw.Window).type = "animation"
20
21# Loop over data types, 1 page per data type
22for dType in list(resDict.keys()):
23    ap = hw.Page(title=dType, layout=9)
24    ses.setActive(hw.Page, page=ap)
25
26    # Loop over data components, one window per component
27    for i, w in enumerate(ses.getWindows()):
28        dComp = resDict.get(dType)[i]
29        ses.setActive(hw.Window, window=w)
30
31        # Load Model
32        w.addModelAndResult(modelFile, result=resultFile)
33
34        # Set scalar results
35        res = ses.get(hv.Result)
36        resScalar = ses.get(hv.ResultDefinitionScalar)
37        resScalar.setAttributes(dataType=dType, dataComponent=dComp)
38
39        # Plot results
40        res.plot(resScalar)
41
42        # Set frame with AnimationTool()
43        animTool = hw.AnimationTool()
44        # animTool.currentFrame=1
45
46        # Modify view with evalHWC
47        hw.evalHWC("view orientation iso")
48
49        # Add SectionCut at Max Entity
50        entityFilter = hv.FilterByScalar(operator="topN", value=1)
51        if dType == "Displacement":
52            # Set animation frame 1
53            animTool = hw.AnimationTool()
54            animTool.currentFrame = 1
55            # Create Collection via TopN filter
56            maxNodeCol = hv.Collection(hv.Node, populate=False)
57            maxNodeCol.addByFilter(entityFilter)
58            # Get centroid of element with maximum scalar value
59            maxNode = maxNodeCol.getEntities()[0]
60            # Add SectionCut Planar
61            secPlanar = hv.SectionCutPlanar(
62                label="Node " + str(maxNode.id),
63                gridSpaceX=100,
64                gridSpaceY=100,
65                gridText=True,
66            )
67            secPlanar.setOrientationByAxis("y")
68            secPlanar.setBaseNode(maxNode.id)
69            hw.evalHWC("view fit")
70            secPlanar.setAttributes(featureLines=True, transparency=True)
71        elif dType == "Stress":
72            # Create Collection via TopN filter
73            maxElemCol = hv.Collection(hv.Element, populate=False)
74            maxElemCol.addByFilter(entityFilter)
75            # Get centroid of element with maximum scalar value
76            maxElem = maxElemCol.getEntities()[0]
77            baseCoords = maxElem.centroid
78            # Add Section Cut Spherical
79            secRadius = 600
80            secSphere = hv.SectionCutSpherical(
81                label="Element " + str(maxElem.id), radius=secRadius
82            )
83            secSphere.center = baseCoords
84            hw.evalHWC("view fit")
85            secSphere.setAttributes(featureLines=True, transparency=True)
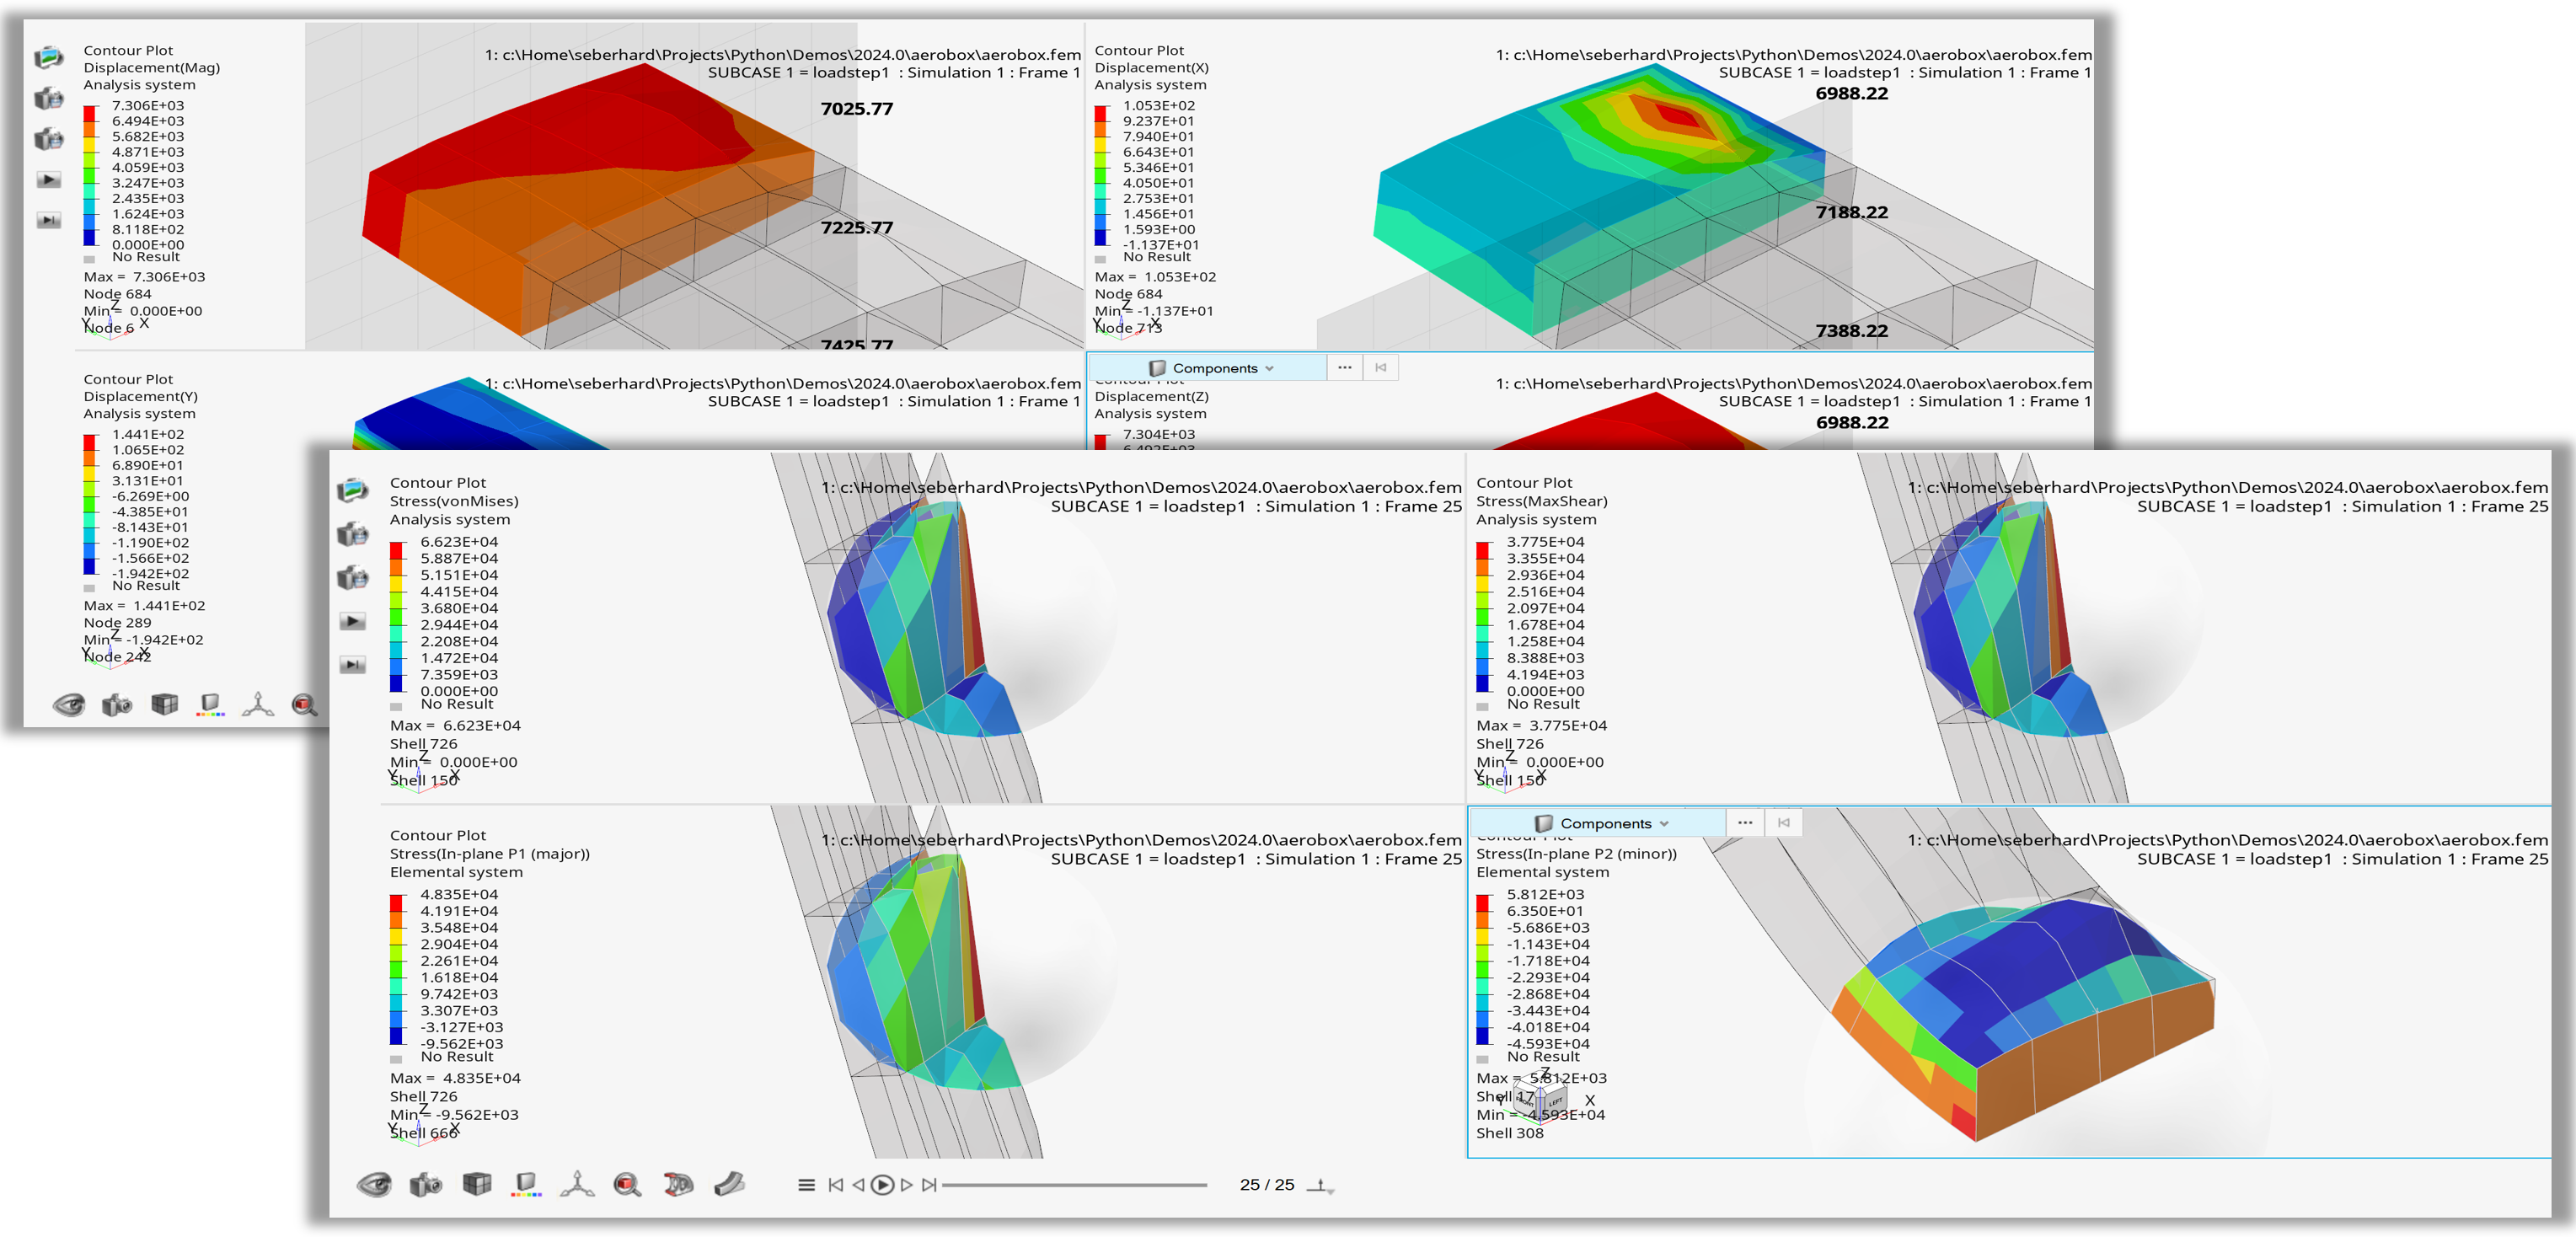
Figure 1. Planar and spherical sections positioned using Collections and TopN filter
Example 02 - Systems#
Following the standard steps (setting up the window, loading the model/result files, setting the required simulation step), the model view is set using evalHWC() with the HWC view command.
Three systems are created using the hv.System(type='rectangular'), the hv.System(type='cylindrical') and the hv.System(type='spherical') class constructors.
The rectangular system is positioned by three Node objects setting origin, axis and axisplane. The cylindrical system is defined using coordinate lists/tuples instead of node objects. The spherical system uses the setOrientationByCircleCenter() method with 3 node objects.
 1import hw
 2import hw.hv as hv
 3import os
 4
 5ALTAIR_HOME = os.path.abspath(os.environ['ALTAIR_HOME'])
 6modelFile   = os.path.join(ALTAIR_HOME,'demos','mv_hv_hg','animation','dyna','bumper','bumper_deck.key')
 7resultFile  = os.path.join(ALTAIR_HOME,'demos','mv_hv_hg','animation','dyna','bumper','d3plot')
 8
 9ses = hw.Session()
10ses.new()
11win=ses.get(hw.Window)
12win.type = 'animation'
13
14win.addModelAndResult(modelFile, result=resultFile)
15
16animTool = hw.AnimationTool()
17animTool.currentFrame = 26
18pCol = hv.Collection(hv.Part)
19[p.setAttributes(meshMode='transparent',color=(216, 216, 216)) for p in  pCol.getEntities()]
20
21hw.evalHWC('view projection orthographic | \
22        view matrix 0.174593 0.948911 0.262841 \
23                 0.000000 -0.964156 0.218925 \
24                -0.149918 0.000000 -0.199801 \
25                -0.227245 0.953121 0.000000 \
26                150.394730 587.232971 -658.386963 1.000000 | \
27        view clippingregion -129.361221 -25.731152 654.478882 \
28                738.350830 -722.333801 601.748169')
29
30model = ses.get(hv.Model)
31n1 = model.get(hv.Node,1898)
32n2 = model.get(hv.Node,1890)
33n3 = model.get(hv.Node,1895)
34
35sysRect = hv.System(type='rectangular',fixed=False)
36sysRect.label = 'Rectangular System'
37sysRect.color = '#ff0000'
38sysRect.labelVisibility = True
39sysRect.setOrientationByNode(origin     = n1,
40             axis       = n2,
41             plane      = n3,
42             axisplane  = 'X-XY')
43
44sysCyl  = hv.System(type='cylindrical')
45sysCyl.label = 'Cylindrical System'
46sysCyl.color = '#006400'
47sysCyl.labelVisibility = True
48sysCyl.setOrientationByCoords(origin    = [226.614,159.179,622.441],
49                xaxis   = [226.739,169.193,622.378],
50                xyplane = [207.319,159.158,623.268])
51
52model = ses.get(hv.Model)
53n4 = model.get(hv.Node,1547)
54n5 = model.get(hv.Node,1534)
55n6 = model.get(hv.Node,1537)
56
57sysSpher = hv.System(type='spherical')
58sysSpher.label = 'Spherical System'
59sysSpher.color = '#0000ff'
60sysSpher.labelVisibility = True
61sysSpher.setOrientationByCircleCenter(node1=n4,node2=n5,node3=n6)
62
63win.draw()
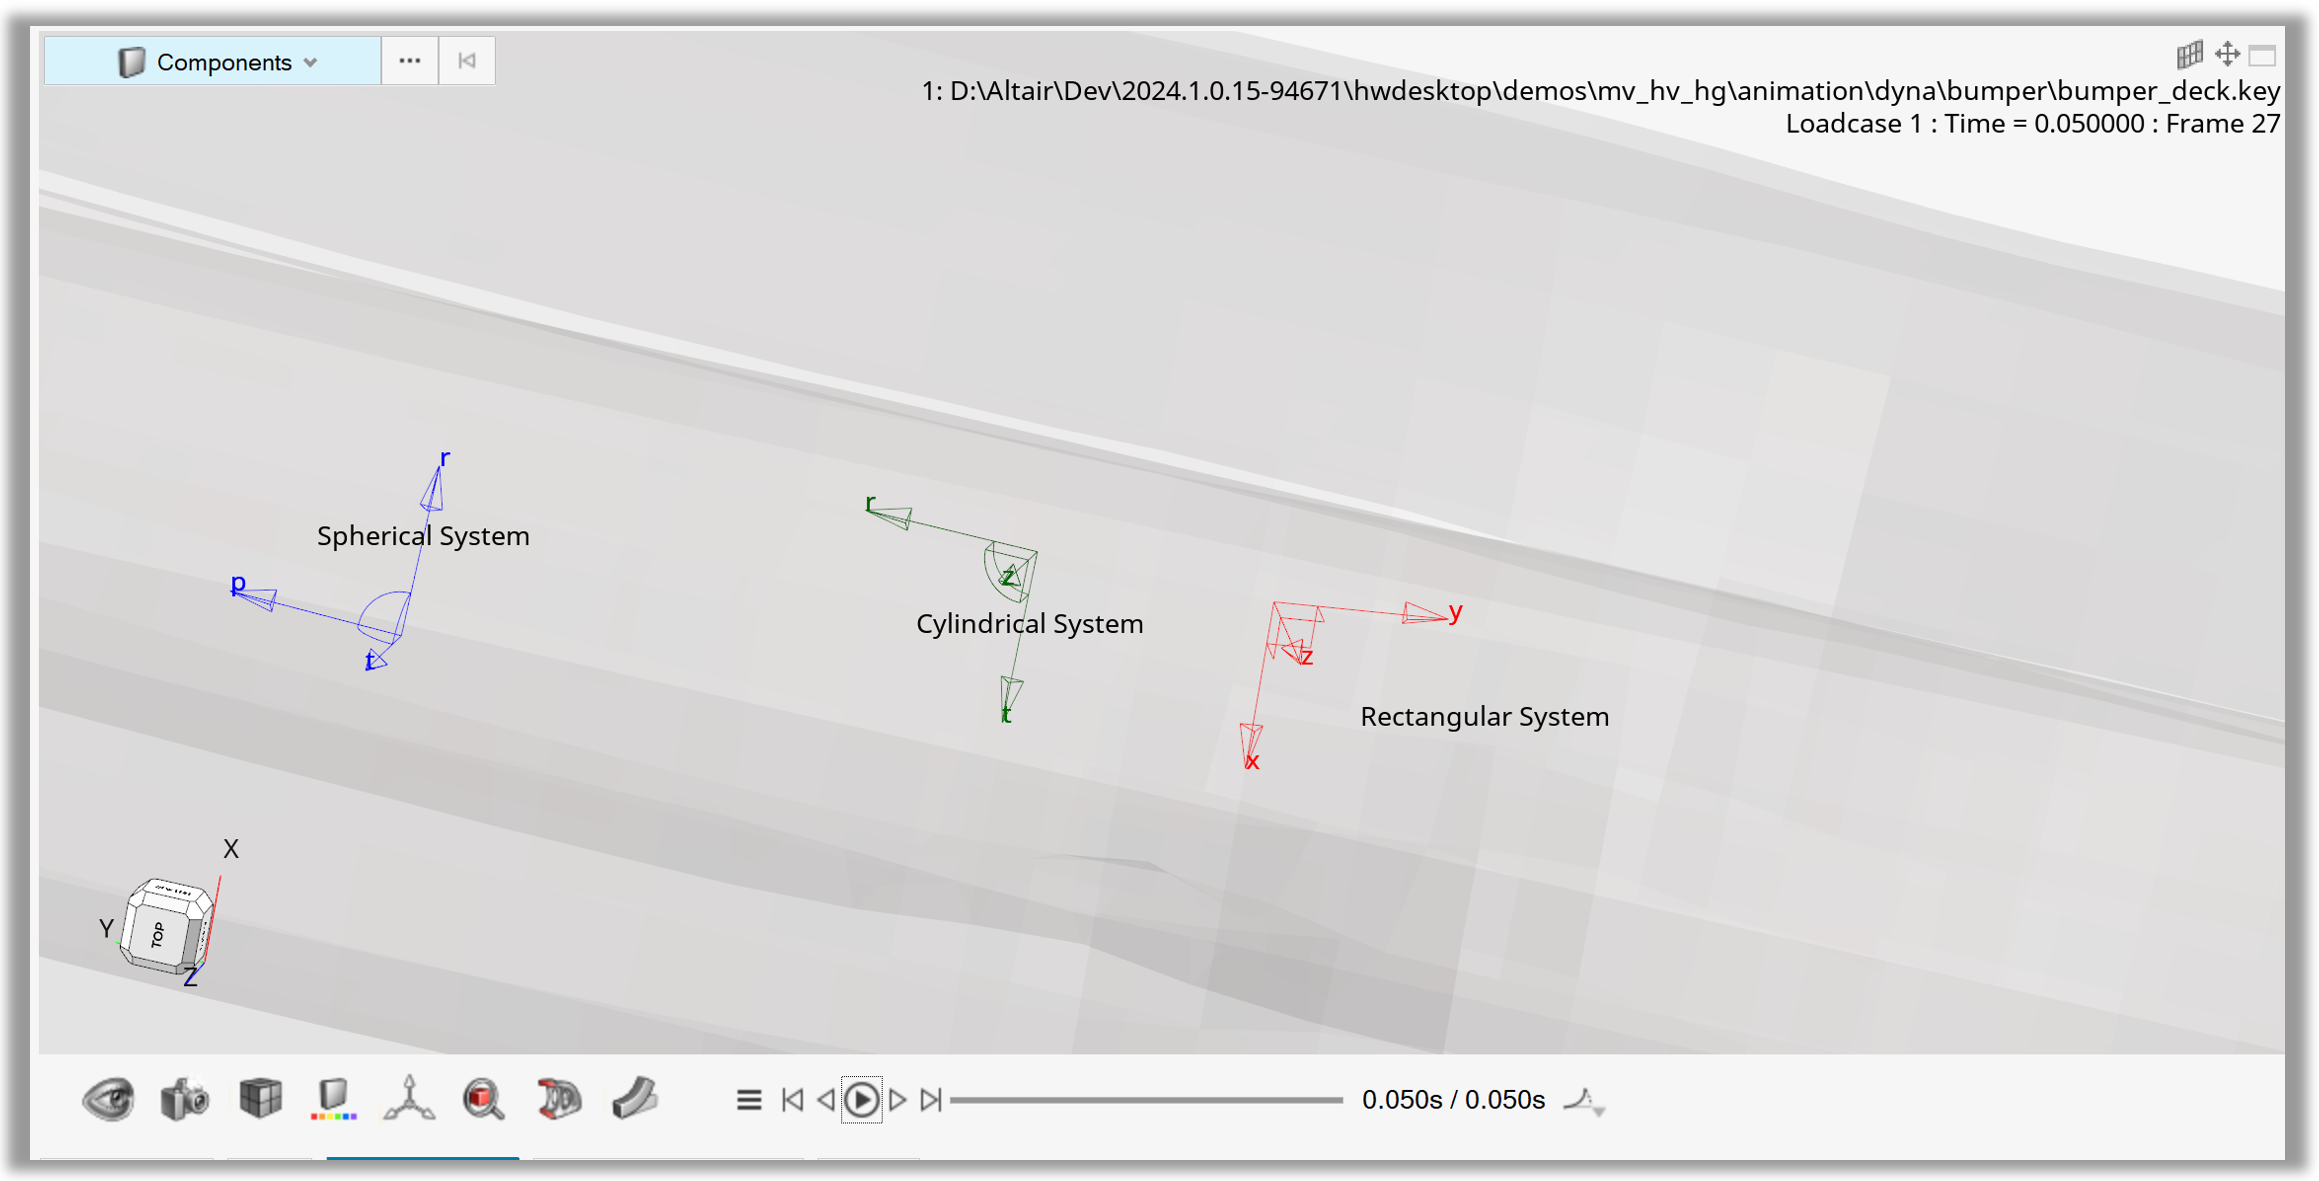
Figure 2. Rectangular, circular and spherical systems based
Example 03 - Part Set from Interactive Selection#
Following the standard steps (setting up the window, loading the model file), the script starts an interactive part selection using the InteractiveSelection class.
The collection returned by this class is used to create a part set using the Set class.
The color of all parts in this set is changed to blue and the draw style to wireframe.
 1import hw
 2import hw.hv as hv
 3import os
 4
 5ALTAIR_HOME = os.path.abspath(os.environ['ALTAIR_HOME'])
 6modelFile   = os.path.join(ALTAIR_HOME,'demos','mv_hv_hg','animation','h3d','NEON_FRONT.h3d')
 7
 8ses = hw.Session()
 9ses.new()
10win=ses.get(hw.Window)
11# Set Window to Animation
12win.type = 'animation'
13# Add Model
14win.addModelAndResult(modelFile)
15
16inSel = hv.InteractiveSelection()
17pCol=inSel.select()
18print('Selection type    = {}'.format(inSel.type))
19print('Collection size   = {}'.format(pCol.getSize()))
20print('{} selected'.format(inSel.type))
21print('')
22for p in pCol.getEntities():
23    p.color=(0,0,255)
24    print('    Part id = {} name = {}'.format(p.id,p.name))
25
26entSet = hv.Set(hv.Part,populate = False)
27entSet.addByCollection(pCol)
28entSet.setAttributes(label = "My Part Set",
29         drawSize  = 6,
30         drawStyle = 'wire',
31         color=(255,0,0))
32print('')
33print('Set size of "{}" = {}'.format(entSet.label,entSet.getSize()))
34
35pColRest=hv.Collection(hv.Part)-pCol
36for p in pColRest.getEntities():
37    p.setAttributes(meshMode='transparent',color=(240,240,240))
38win.draw()
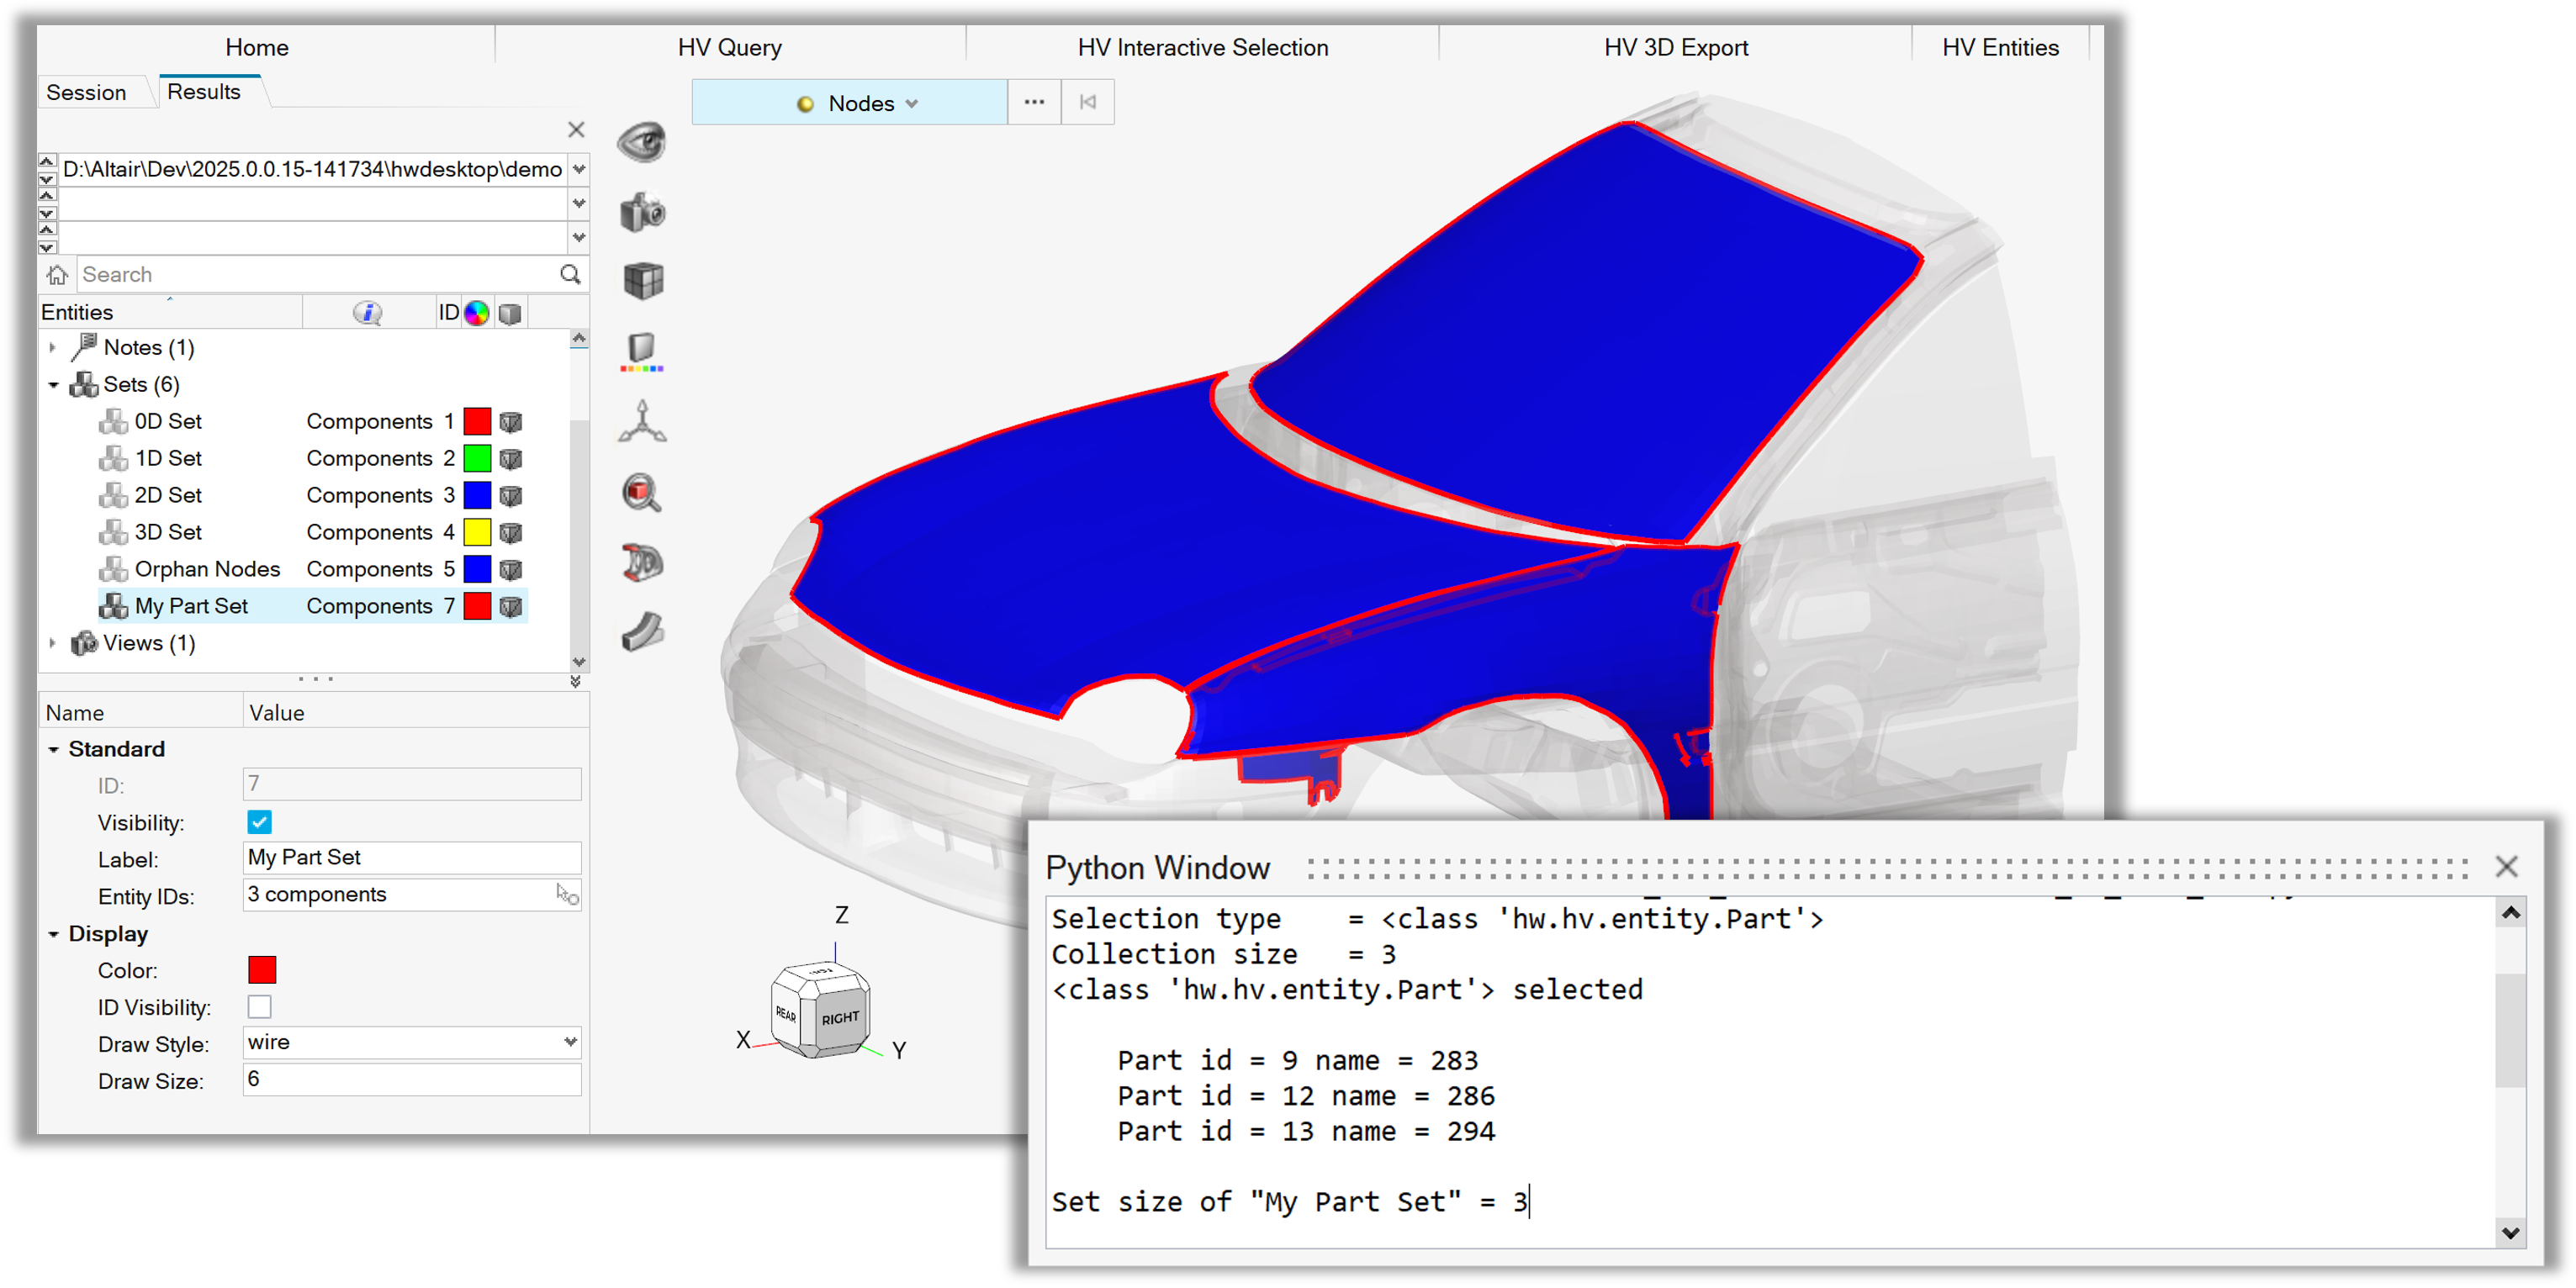
Figure 3. Modify Part Set from Interactive Selection
Example 04 - ApplyStyle Default Settings#
The script uses the ApplyStyle class with the default settings to apply the attributes of the currently active model to all the models in the other animation windows of the active page.
1import hw.hv as hv
2
3applyStyle = hv.ApplyStyle()
4applyStyle.setAllAttributes('default')
5applyStyle.apply()
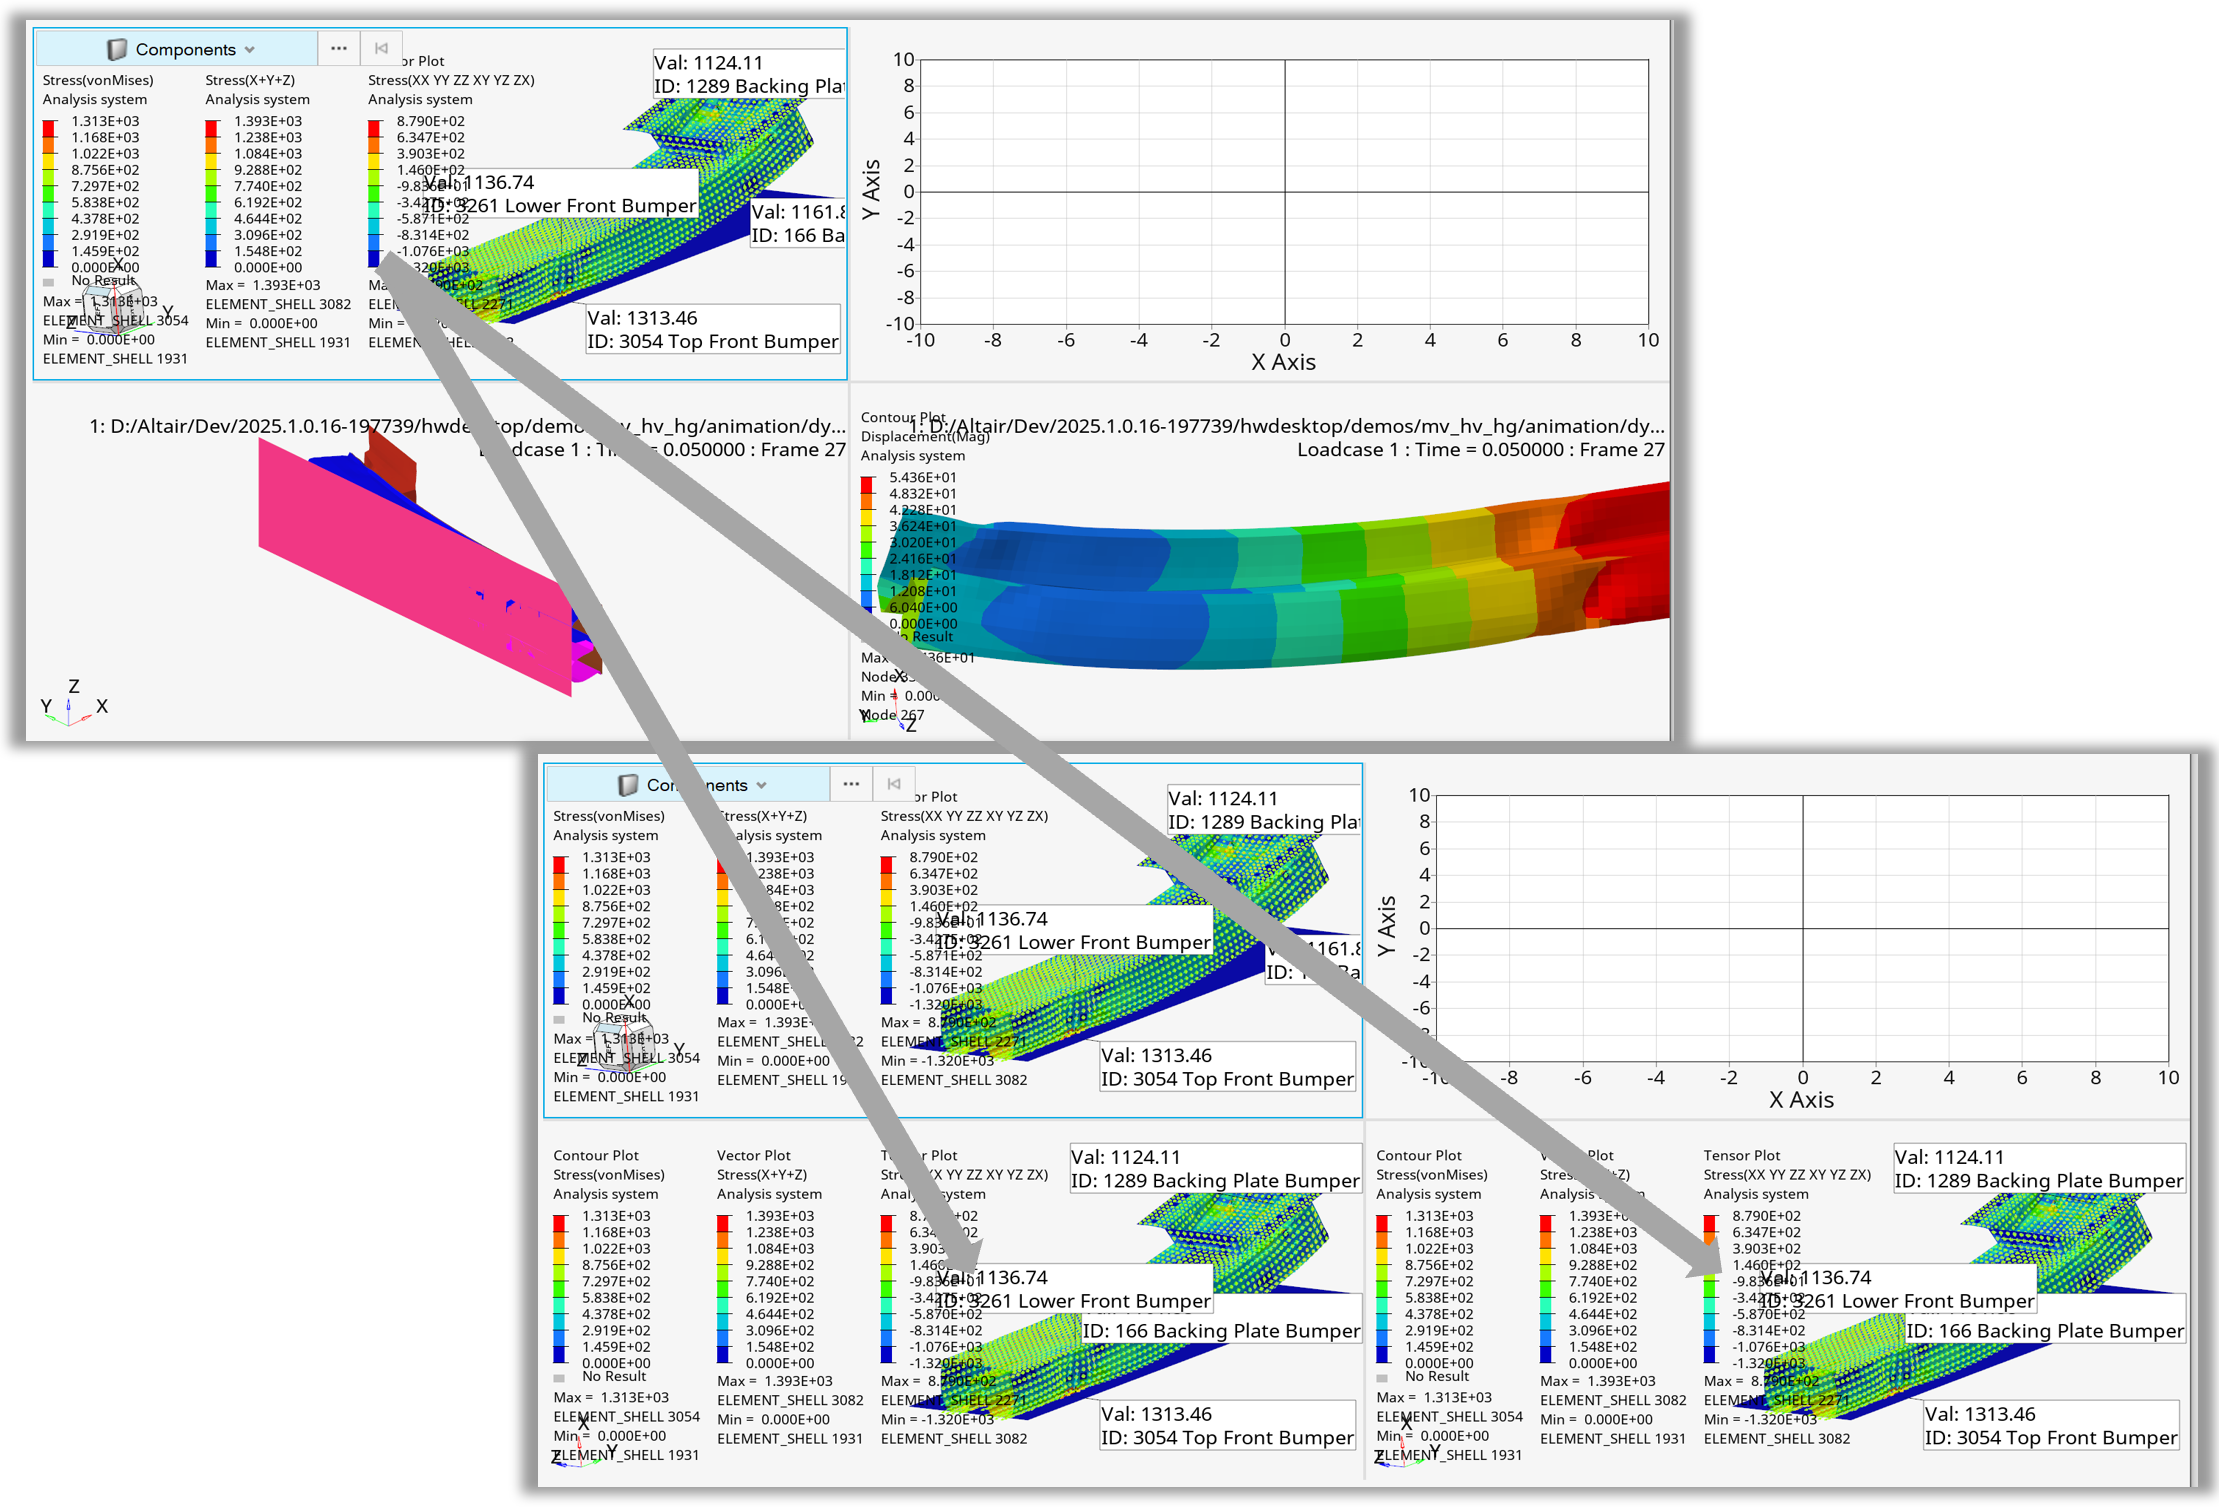
Figure 4. ApplyStyle with default settings from active window to all animation windows on active page
Example 05 - ApplyStyle Source and Target#
This variant of ApplyStyle uses the ApplyStyle class with all attributes set to True.
The source model is a model in a non-active window, the target list consists of two Window objects in different pages and a Page object.
Using the page object will change the style of all models in this page, independent from the page layout.
 1import hw
 2import hw.hv as hv
 3session=hw.Session()
 4
 5source = session.get(hw.Window,page=1, window=4)
 6
 7targetList = [session.get(hw.Window,page=1,window=3),
 8              session.get(hw.Window,page=2,window=4),
 9              session.get(hw.Page,  page=3)]
10
11applyStyle = hv.ApplyStyle()
12applyStyle.setAllAttributes(True)
13applyStyle.source = source
14applyStyle.setTarget(targetList)
15applyStyle.apply()
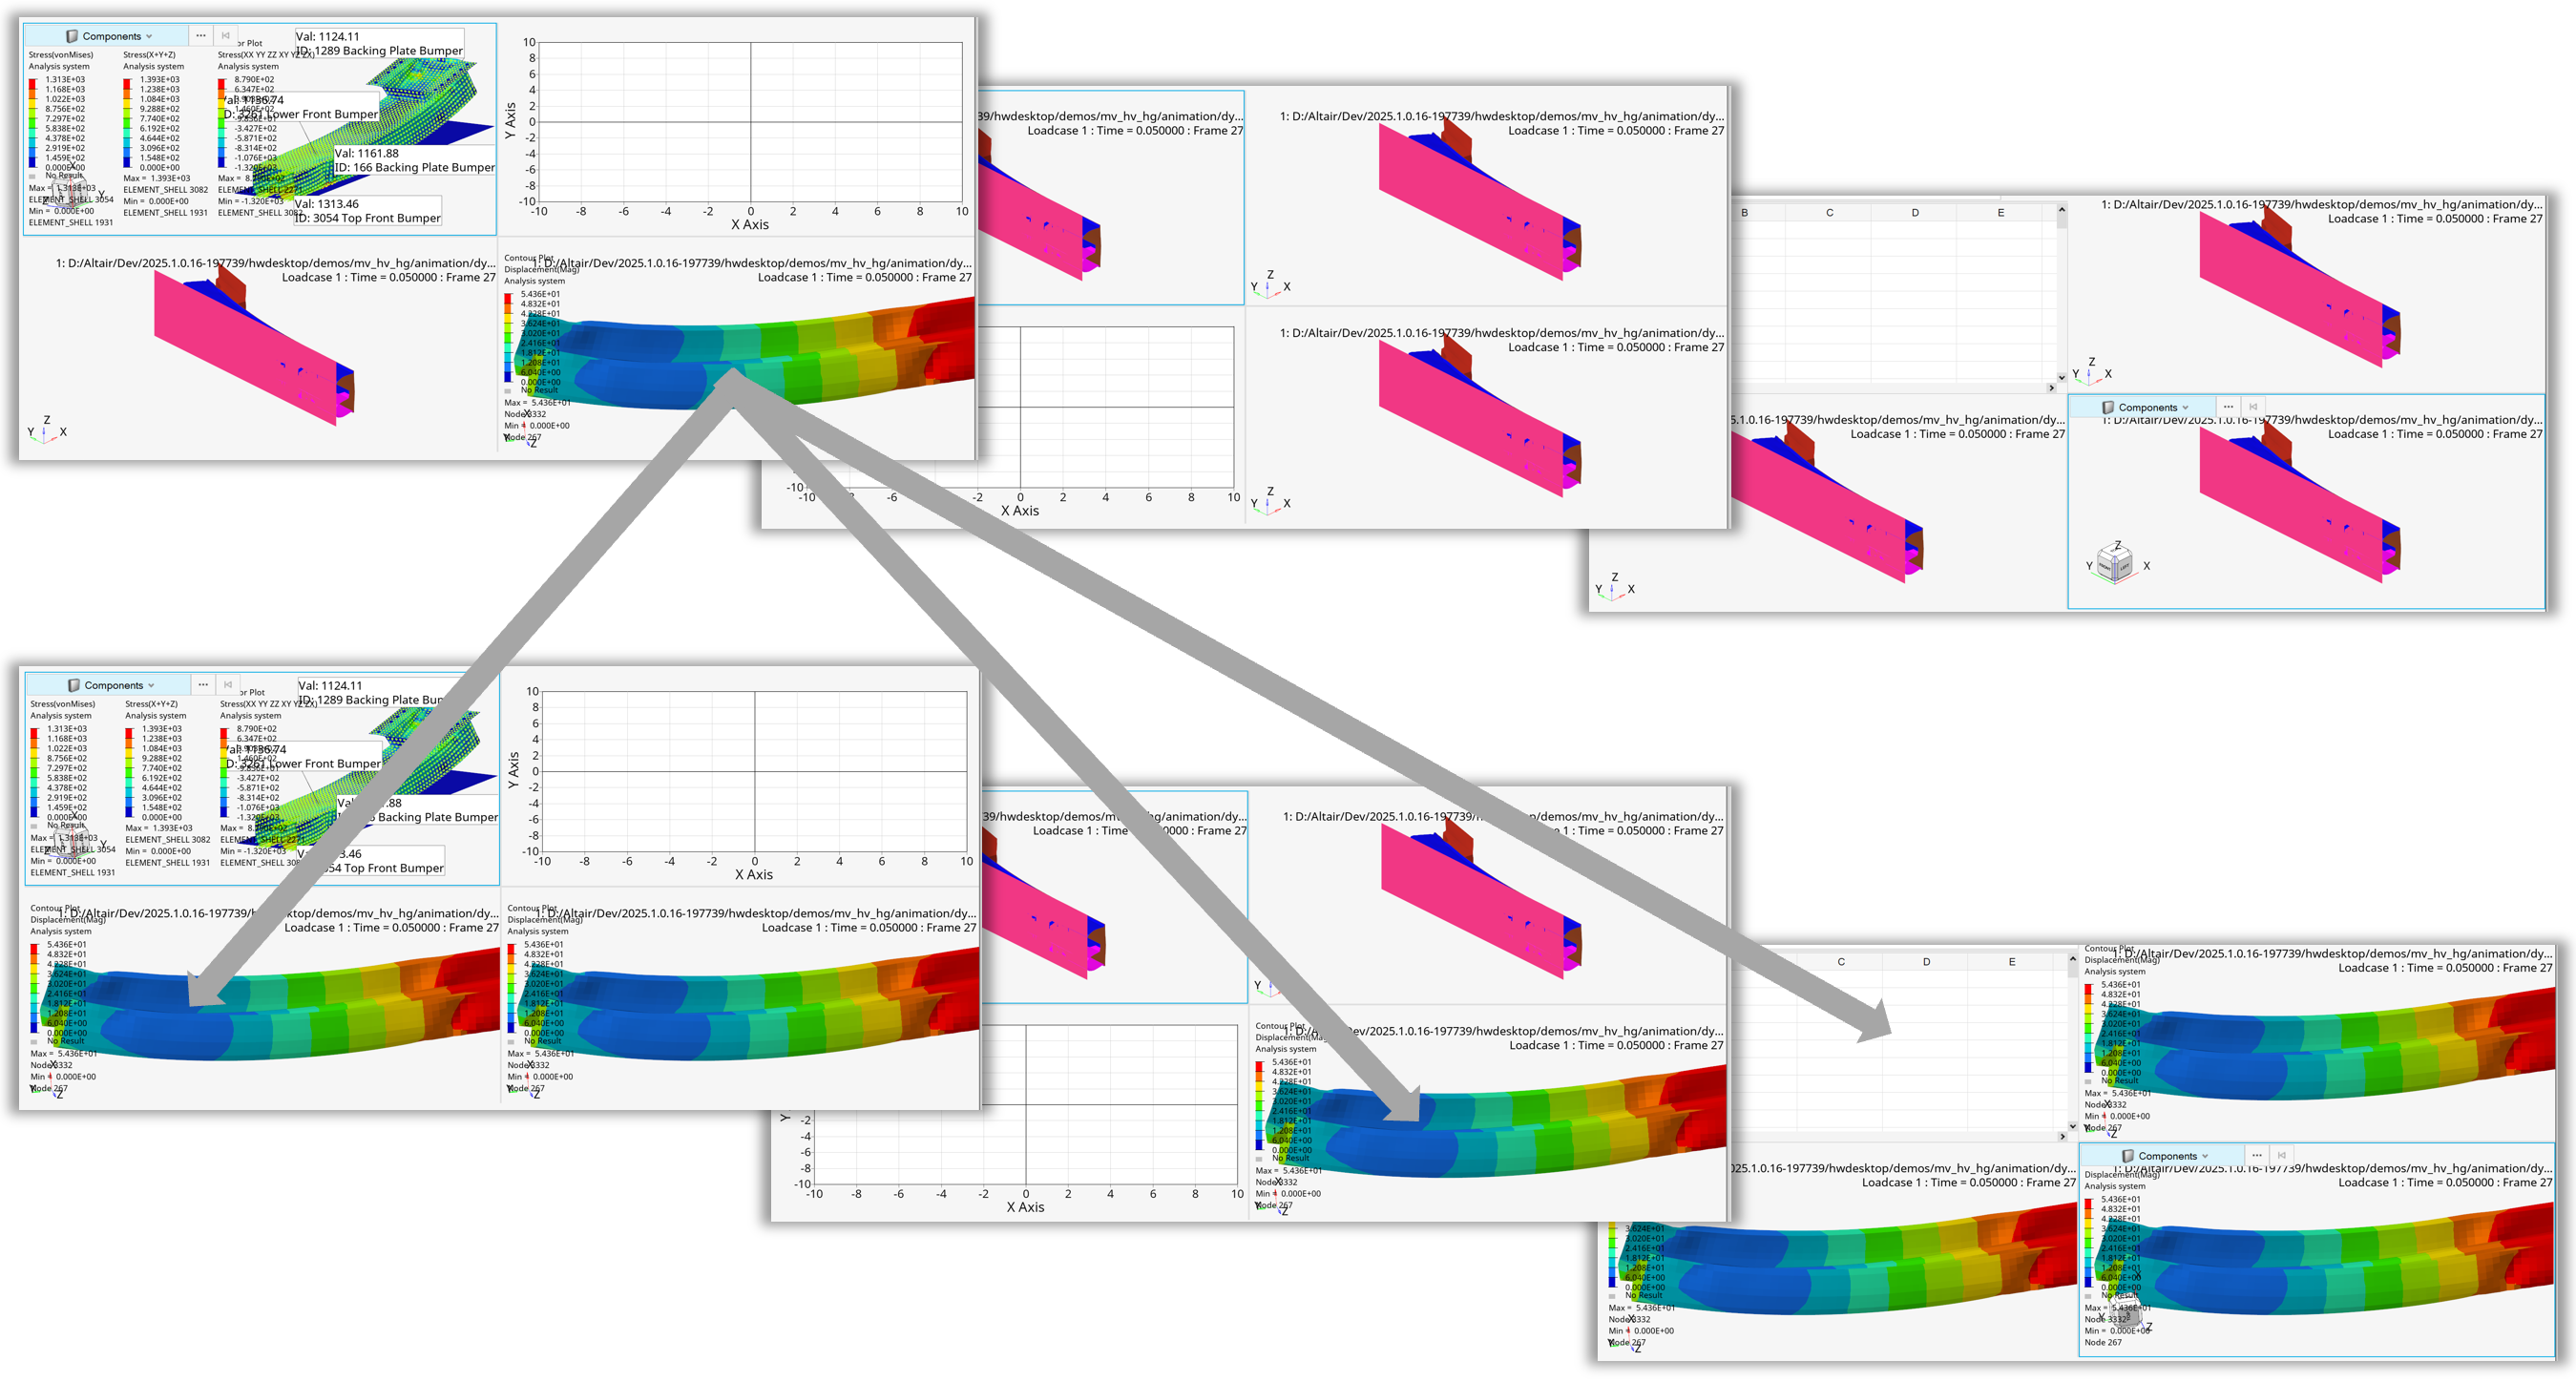
Figure 5. ApplyStyle from non-active source window to window and page target list
Example 06 - Tracing Node Collection#
After loading the model and result file, all model parts are set to mesh mode transparent using a part collection.
Both a tracing object and a node collection with four nodes are created. Using the addEntity() method, the node collection is added to the tracing object.
The thickness of the trace lines is increased for better visualization, and the model is animated once so that the trace lines are displayed in the graphics area.
Note
In HyperView, the tracing entity is represented by the Tracing class.
 1    import hw
 2    import hw.hv as hv
 3    import os
 4    import sys
 5    import time
 6
 7    def animOnce():
 8            ses = hw.Session()
 9            win= ses.get(hw.Window)
10            res = ses.get(hv.Result)
11            animTool=hw.AnimationTool()
12            animTool.currentFrame = 0
13            for i in range(0,res.getSimulationIds()[-2]):
14                    animTool.next()
15                    win.draw()
16
17    scriptDir   = os.path.abspath(os.path.dirname(__file__)).replace('\\','/')
18    modelFile   = os.path.join(scriptDir,'.','truck','truck.key').replace('\\','/')
19    resultFile  = os.path.join(scriptDir,'.','truck','d3plot').replace('\\','/')
20
21    ses = hw.Session()
22    ses.new()
23    win= ses.get(hw.Window)
24    win.type = 'animation'
25    win.addModelAndResult(modelFile, result=resultFile)
26
27    partCol = hv.Collection(hv.Part)
28    for p in partCol.getEntities():
29            p.meshMode = 'transparent'
30
31    tracing = hv.Tracing()
32    tracing.moveWithTracking = True
33    nodeCol = hv.Collection(hv.Node,populate=False)
34    nodeCol.addByID(hv.Node,[22437,22450,22460,22461])
35    tracing.addEntity(nodeCol)
36    tracing.thickness = 8
37
38    animOnce()
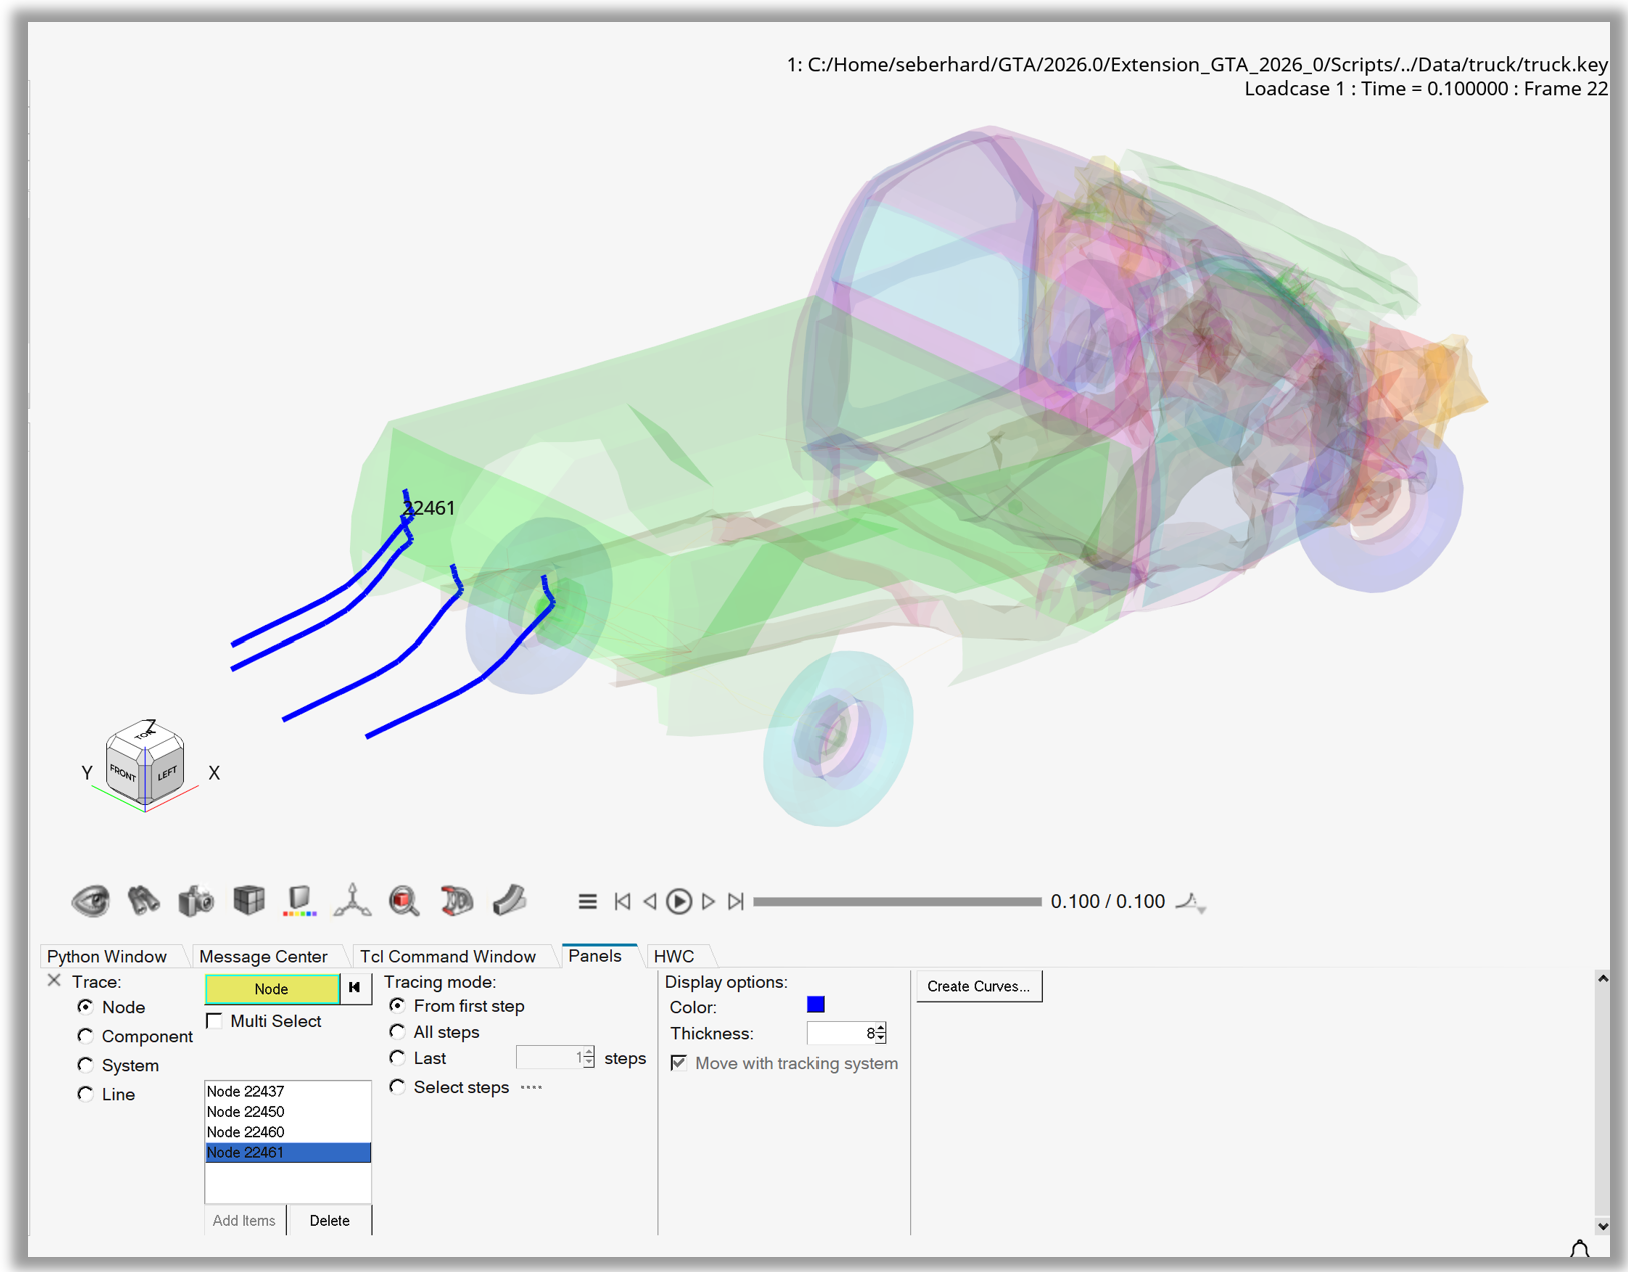
Figure 6. Tracing Node Collection
Example 07 - Tracing Nodes Curves with Colors#
After loading the model and result file, all model parts are set to mesh mode transparent using a part collection.
By looping over both a node list and a color list simultaneously, the addEntity() method is used to add node objects for tracing, while the setEntityColor() method is used to set the color of the trace lines.
The thickness of the trace lines is increased for better visualization, and the model is animated once so that the trace lines are displayed in the graphics area.
Finally, the curve() method creates a new plotting window with separate live-link curves for each node in the node list.
Note
In HyperView, the tracing entity is represented by the Tracing class.
 1    import hw
 2    import hw.hv as hv
 3    import os
 4    import sys
 5    import time
 6
 7    def animOnce():
 8            ses = hw.Session()
 9            win= ses.get(hw.Window)
10            res = ses.get(hv.Result)
11            animTool=hw.AnimationTool()
12            animTool.currentFrame = 0
13            for i in range(0,res.getSimulationIds()[-2]):
14                    animTool.next()
15                    win.draw()
16
17    scriptDir   = os.path.abspath(os.path.dirname(__file__)).replace('\\','/')
18    modelFile   = os.path.join(scriptDir,'.','truck','truck.key').replace('\\','/')
19    resultFile  = os.path.join(scriptDir,'.','truck','d3plot').replace('\\','/')
20
21    ses = hw.Session()
22    ses.new()
23    win= ses.get(hw.Window)
24    win.type = 'animation'
25    win.addModelAndResult(modelFile, result=resultFile)
26    model = ses.get(hv.Model)
27
28    partCol = hv.Collection(hv.Part)
29    for p in partCol.getEntities():
30            p.meshMode = 'transparent'
31
32    tracing = hv.Tracing()
33    nodeIdList = [22422, 22437,22450,22461]
34    colorList = [(38, 85, 199),(200, 40, 23),(53, 125, 44),(198, 49, 199)]
35    tracing.thickness = 8
36    for color,nodeId in zip(colorList,nodeIdList):
37            node = model.get(hv.Node,nodeId)
38            tracing.addEntity(node)
39            tracing.setEntityColor(node,color)
40    tracing.thickness = 4
41    animOnce()
42    tracing.curve(nodeIdList,
43                    singleCurve=False,
44                    liveLink=True,
45                    yAxis='y')

Figure 7. Tracing Nodes Curves with Colors
Example 08 - Tracing Colored Parts#
After loading the model and result file, all model parts are set to mesh mode transparent using a part collection.
By looping over both a part list and a color list simultaneously, the addEntity() method is used to add part objects for tracing, while the setEntityColor() method is used to assign colors to the parts.
The thickness of the trace lines is reduced for better visualization, and the model is animated once so that the trace lines are displayed in the graphics area.
Note
In HyperView, the tracing entity is represented by the Tracing class.
 1    import hw
 2    import hw.hv as hv
 3    import os
 4    import sys
 5    import time
 6
 7    def animOnce():
 8            ses = hw.Session()
 9            win= ses.get(hw.Window)
10            res = ses.get(hv.Result)
11            animTool=hw.AnimationTool()
12            animTool.currentFrame = 0
13            for i in range(0,res.getSimulationIds()[-2]):
14                    animTool.next()
15                    win.draw()
16
17    scriptDir   = os.path.abspath(os.path.dirname(__file__)).replace('\\','/')
18    modelFile   = os.path.join(scriptDir,'.','truck','truck.key').replace('\\','/')
19    resultFile  = os.path.join(scriptDir,'.','truck','d3plot').replace('\\','/')
20
21    ses = hw.Session()
22    ses.new()
23    win= ses.get(hw.Window)
24    win.type = 'animation'
25    win.addModelAndResult(modelFile, result=resultFile)
26    model = ses.get(hv.Model)
27
28    partCol = hv.Collection(hv.Part)
29    for p in partCol.getEntities():
30            p.color = (220,220,220)
31
32    tracing = hv.Tracing()
33    tracing.thickness = 1
34    partList = [22,26,11]
35    colorList = [(255,0,0),(0,255,0),(0,0,255)]
36    for color,partId in zip(colorList,partList):
37            part = model.get(hv.Part,partId)
38            tracing.addEntity(part)
39            tracing.setEntityColor(part,color)
40
41    animOnce()
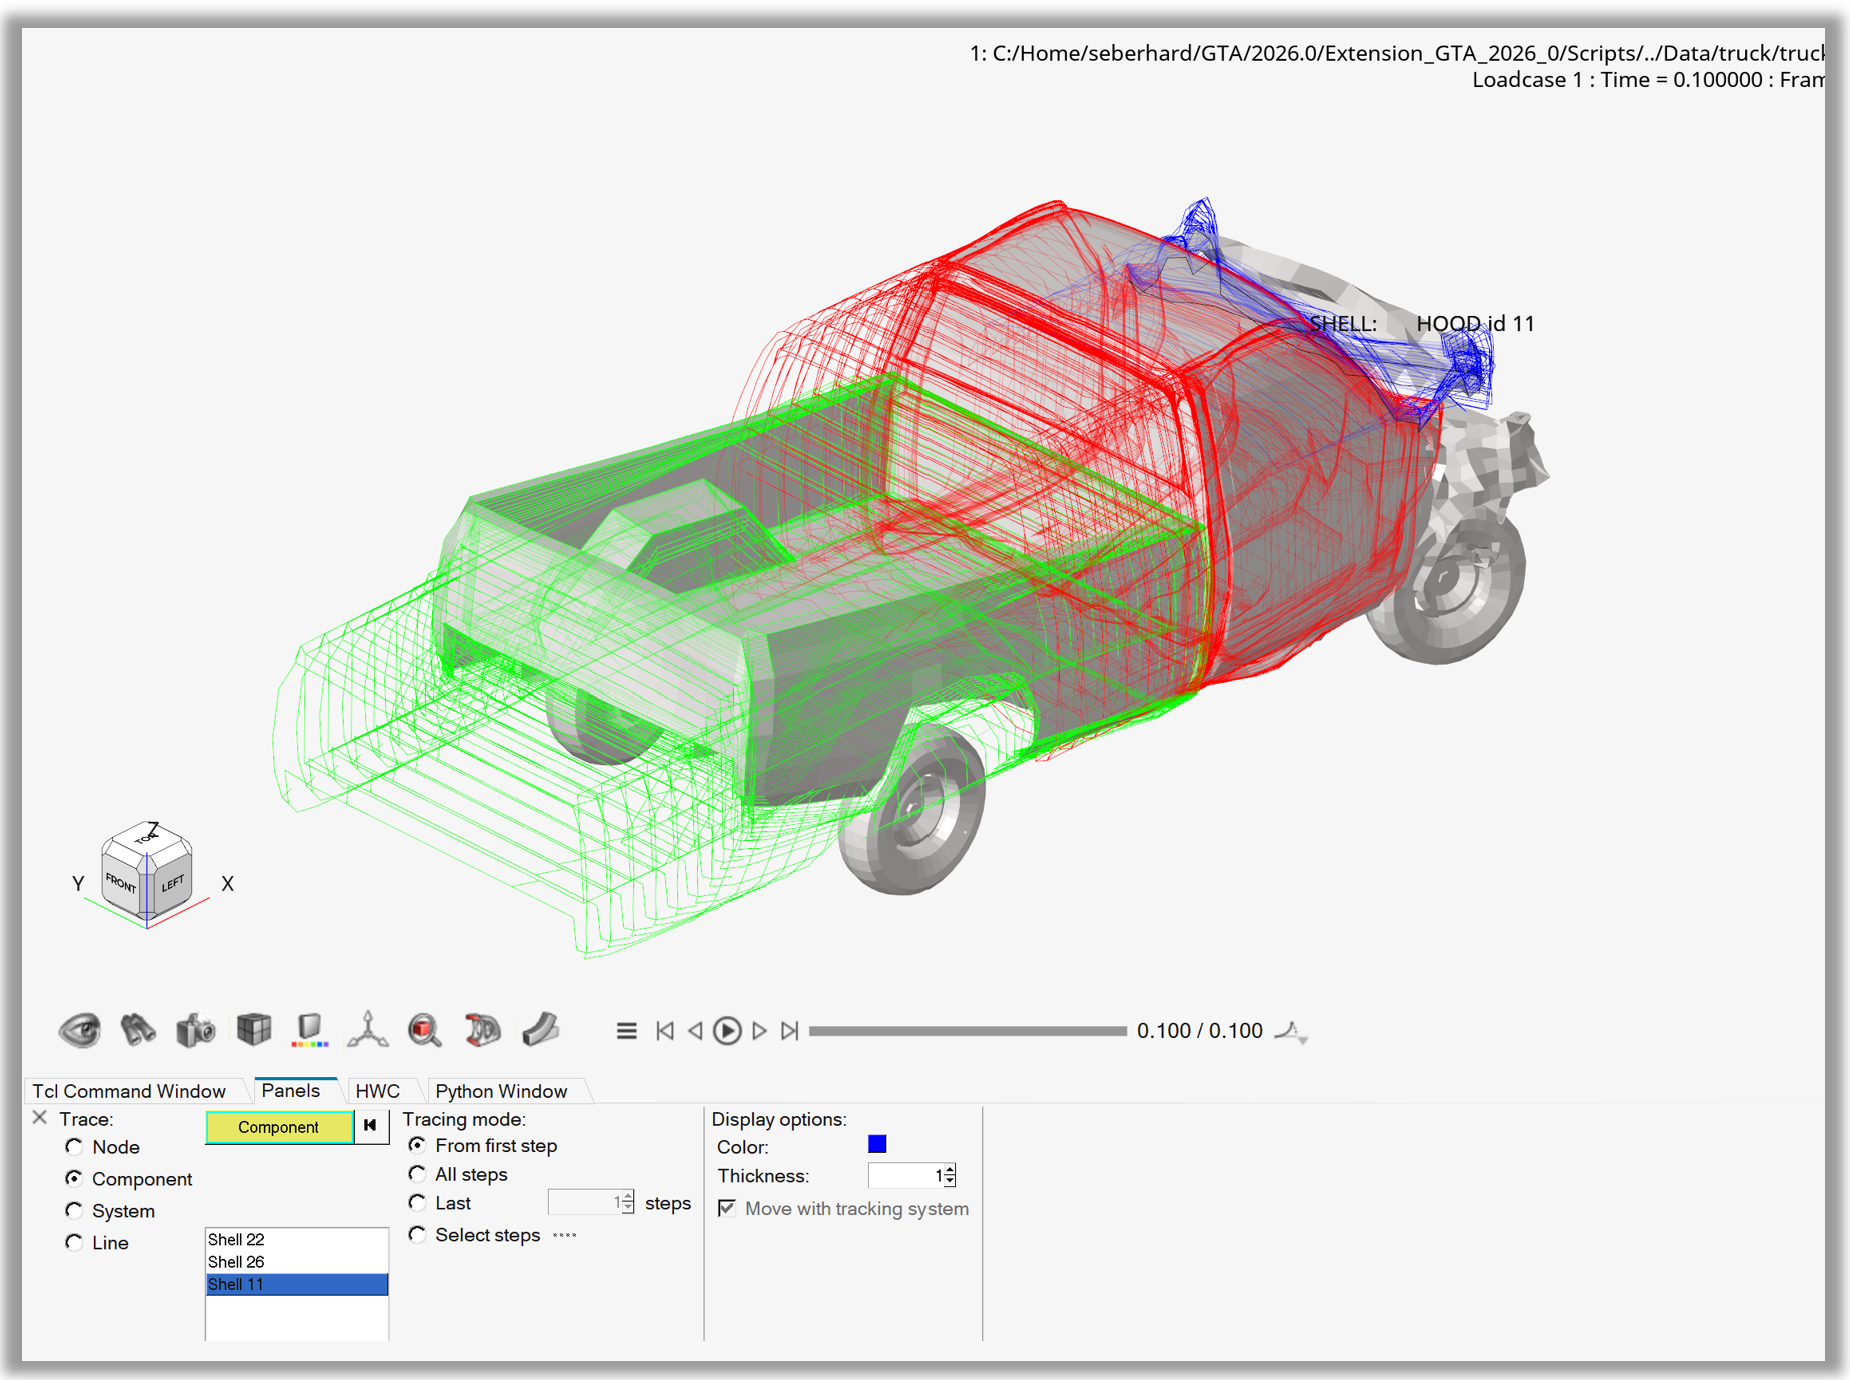
Figure 8. Tracing Colored Parts
Example 09 - TrackingSystem Plane by Nodes#
After loading the model and result file and contouring Displacement – Magnitude, the animation tool is used to set the display to the last timestep.
A new tracking system is then created using a list of three node IDs.
With the useTracking attribute of the result definition scalar object set to True, the displacements are contoured relative to the tracking system.
Note
In HyperView, the tracking sytem entity is represented by the TrackingSystem class.
 1    import hw
 2    import hw.hv as hv
 3    import os
 4
 5    scriptDir   = os.path.abspath(os.path.dirname(__file__)).replace('\\','/')
 6    modelFile   = os.path.join(scriptDir,'.','truck','truck.key').replace('\\','/')
 7    resultFile  = os.path.join(scriptDir,'.','truck','d3plot').replace('\\','/')
 8
 9    ses = hw.Session()
10    ses.new()
11    win= ses.get(hw.Window)
12    win.type = 'animation'
13    win.addModelAndResult(modelFile, result=resultFile)
14    model = ses.get(hv.Model)
15
16    res = ses.get(hv.Result)
17    if ses.getMultiCoreMode():
18            res.loadAnimation(frame='all')
19    resScalar = hv.ResultDefinitionScalar(dataType='Displacement',dataComponent='Mag')
20    res.plot(resScalar,True)
21
22    animTool=hw.AnimationTool()
23    animTool.currentFrame=res.getSimulationIds()[-2]
24    win.draw()
25
26    trackingSystem = hv.TrackingSystem()
27    trackingSystem.makeCurrent()
28    nodePlaneList = [22444,22435,22441]
29    trackingSystem.label = f'Plane by Ids'
30    trackingSystem.plane = nodePlaneList
31    resScalar.useTracking = True
Figure 9. TrackingSystem Plane by Nodes
Example 10 - TrackingSystem by Part#
After loading the model and result file, all model parts are colored gray using a part collection.
A new tracking system is then created using a part object.
The part is colored red, and the model is animated once.
Note
In HyperView, the tracking sytem entity is represented by the TrackingSystem class.
 1    import hw
 2    import hw.hv as hv
 3    import os
 4    import sys
 5    import time
 6
 7    def animOnce():
 8            ses = hw.Session()
 9            win= ses.get(hw.Window)
10            res = ses.get(hv.Result)
11            animTool=hw.AnimationTool()
12            animTool.currentFrame = 0
13            for i in range(0,res.getSimulationIds()[-2]):
14                    animTool.next()
15                    time.sleep(0.02)
16                    win.draw()
17
18    ALTAIR_HOME = os.path.abspath(os.environ['ALTAIR_HOME'])
19    modelFile   = os.path.join(ALTAIR_HOME,'demos','mv_hv_hg','animation','adams','transient_rigid','sla.gra')
20    resultFile  = os.path.join(ALTAIR_HOME,'demos','mv_hv_hg','animation','adams','transient_rigid','sla.gra')
21
22    ses = hw.Session()
23    ses.new()
24    win= ses.get(hw.Window)
25    win.type = 'animation'
26    win.addModelAndResult(modelFile, result=resultFile)
27    model = ses.get(hv.Model)
28
29    partCol = hv.Collection(hv.Part)
30    for p in partCol.getEntities():
31            p.color = (220,220,220)
32
33    trackingSystem = hv.TrackingSystem()
34    trackingSystem.makeCurrent()
35    partId = 130193
36    partObject = model.get(hv.Part,partId)
37    partObject.color = (255, 0, 0)
38    trackingSystem.label = f'Part {partObject.name}'
39    trackingSystem.part = partObject
40    trackingSystem.globalZ = False
41    trackingSystem.windowTrack=True
42    animOnce()
Figure 10. TrackingSystem by Part
Example 11 - Explosion from Model Center#
After loading the model and contouring Stress – von Mises, the animation tool is used to set the display to the last timestep.
Using the Explosion() object, the model scale is set, and the explosion is moved once in the positive direction.
Note
In HyperView, the explosion entity is represented by the Explosion class.
 1    import hw
 2    import hw.hv as hv
 3    import os
 4
 5    scriptDir   = os.path.abspath(os.path.dirname(__file__)).replace('\\','/')
 6    modelFile   = os.path.join(scriptDir,'.','truck','truck.key').replace('\\','/')
 7    resultFile  = os.path.join(scriptDir,'.','truck','d3plot').replace('\\','/')
 8
 9    ses = hw.Session()
10    ses.new()
11    win= ses.get(hw.Window)
12    win.type = 'animation'
13    win.addModelAndResult(modelFile, result=resultFile)
14    res = ses.get(hv.Result)
15    if ses.getMultiCoreMode():
16            res.loadAnimation(frame='all')
17    resScalar = hv.ResultDefinitionScalar(dataType='Stress',dataComponent='vonMises')
18    res.plot(resScalar,True)
19    animTool=hw.AnimationTool()
20    animTool.currentFrame=res.getSimulationIds()[-2]
21    win.draw()
22
23    explosion = hv.Explosion()
24    explosion.makeCurrent()
25    explosion.setAutoFit(True)
26    explosion.modelScale = 1.2
27    explosion.mode = 'model'
28    explosion.label = f'Custom {explosion.mode} Explosion'
29    explosion.setAutoFit(True)
30    for i in range(1,2):
31            explosion.move()
32
33    win.fit()
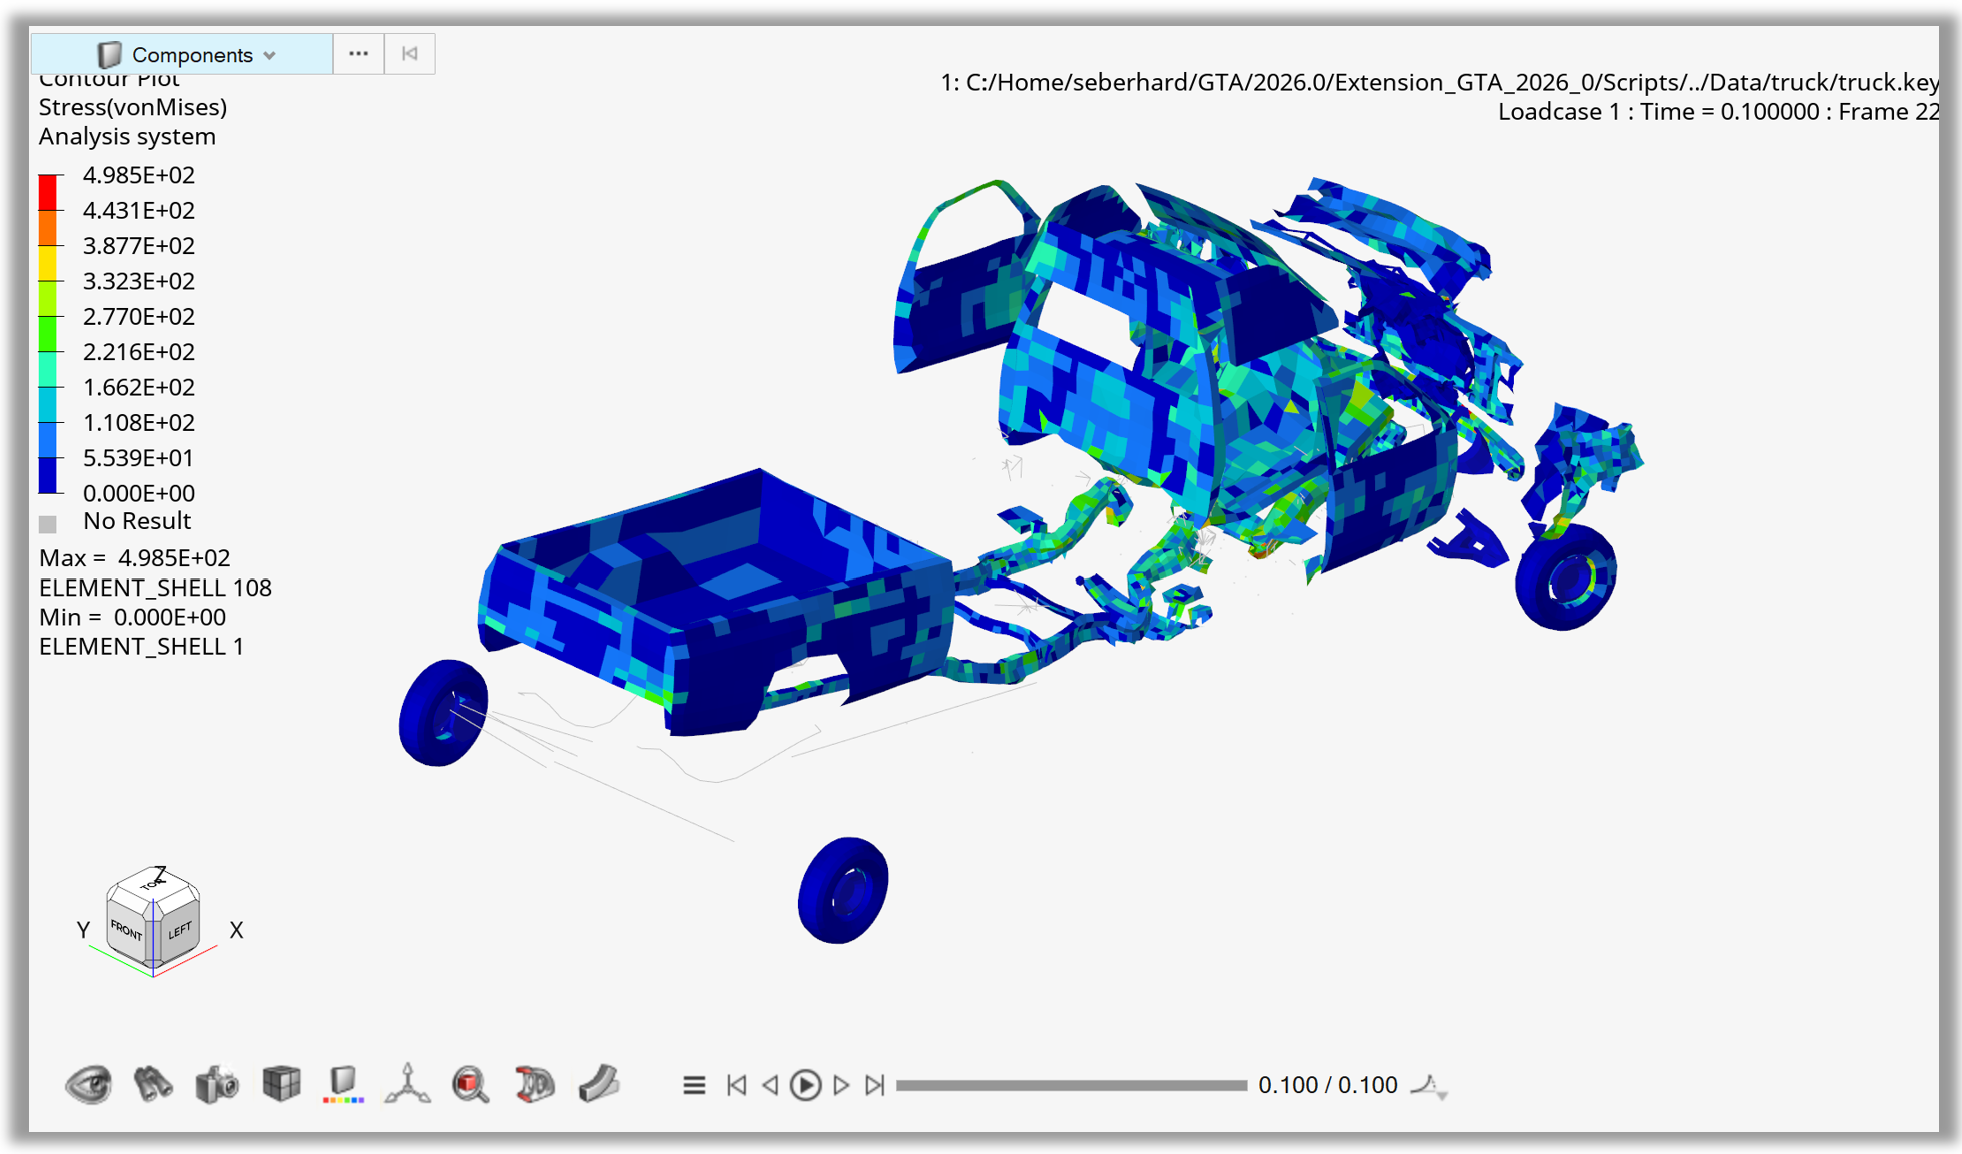
Figure 11. Explosion from Model Center
Example 12 - Explosion Translate Parts#
After loading the model and contouring Stress – von Mises, the animation tool is used to set the display to the last timestep.
The explosion mode is set to Translate, and a part collection containing five parts is defined to specify which parts will be translated.
After the distance and direction for the translation are set, the translation is executed ten times.
Note
In HyperView, the explosion entity is represented by the Explosion class.
 1    import hw
 2    import hw.hv as hv
 3    import os
 4
 5    scriptDir   = os.path.abspath(os.path.dirname(__file__)).replace('\\','/')
 6    modelFile   = os.path.join(scriptDir,'.','truck','truck.key').replace('\\','/')
 7    resultFile  = os.path.join(scriptDir,'.','truck','d3plot').replace('\\','/')
 8
 9    ses = hw.Session()
10    ses.new()
11    win= ses.get(hw.Window)
12    win.type = 'animation'
13    win.addModelAndResult(modelFile, result=resultFile)
14    res = ses.get(hv.Result)
15    if ses.getMultiCoreMode():
16            res.loadAnimation(frame='all')
17    resScalar = hv.ResultDefinitionScalar(dataType='Stress',dataComponent='vonMises')
18    res.plot(resScalar,True)
19    animTool=hw.AnimationTool()
20    animTool.currentFrame=res.getSimulationIds()[-2]
21    win.draw()
22
23    explosion = hv.Explosion()
24    explosion.mode = 'translate'
25    pCol = hv.Collection(hv.Part,populate = False)
26    pCol.addByID(hv.Part,[22,24, 25,26,57])
27    explosion.collection = pCol
28    explosion.translateDistance = 500
29    explosion.translateDirection = [-1, 0, 0]
30    explosion.label = f'Custom {explosion.mode} Explosion'
31    explosion.setAutoFit(True)
32    for i in range(1,11):
33            explosion.move()
34
35    win.fit()
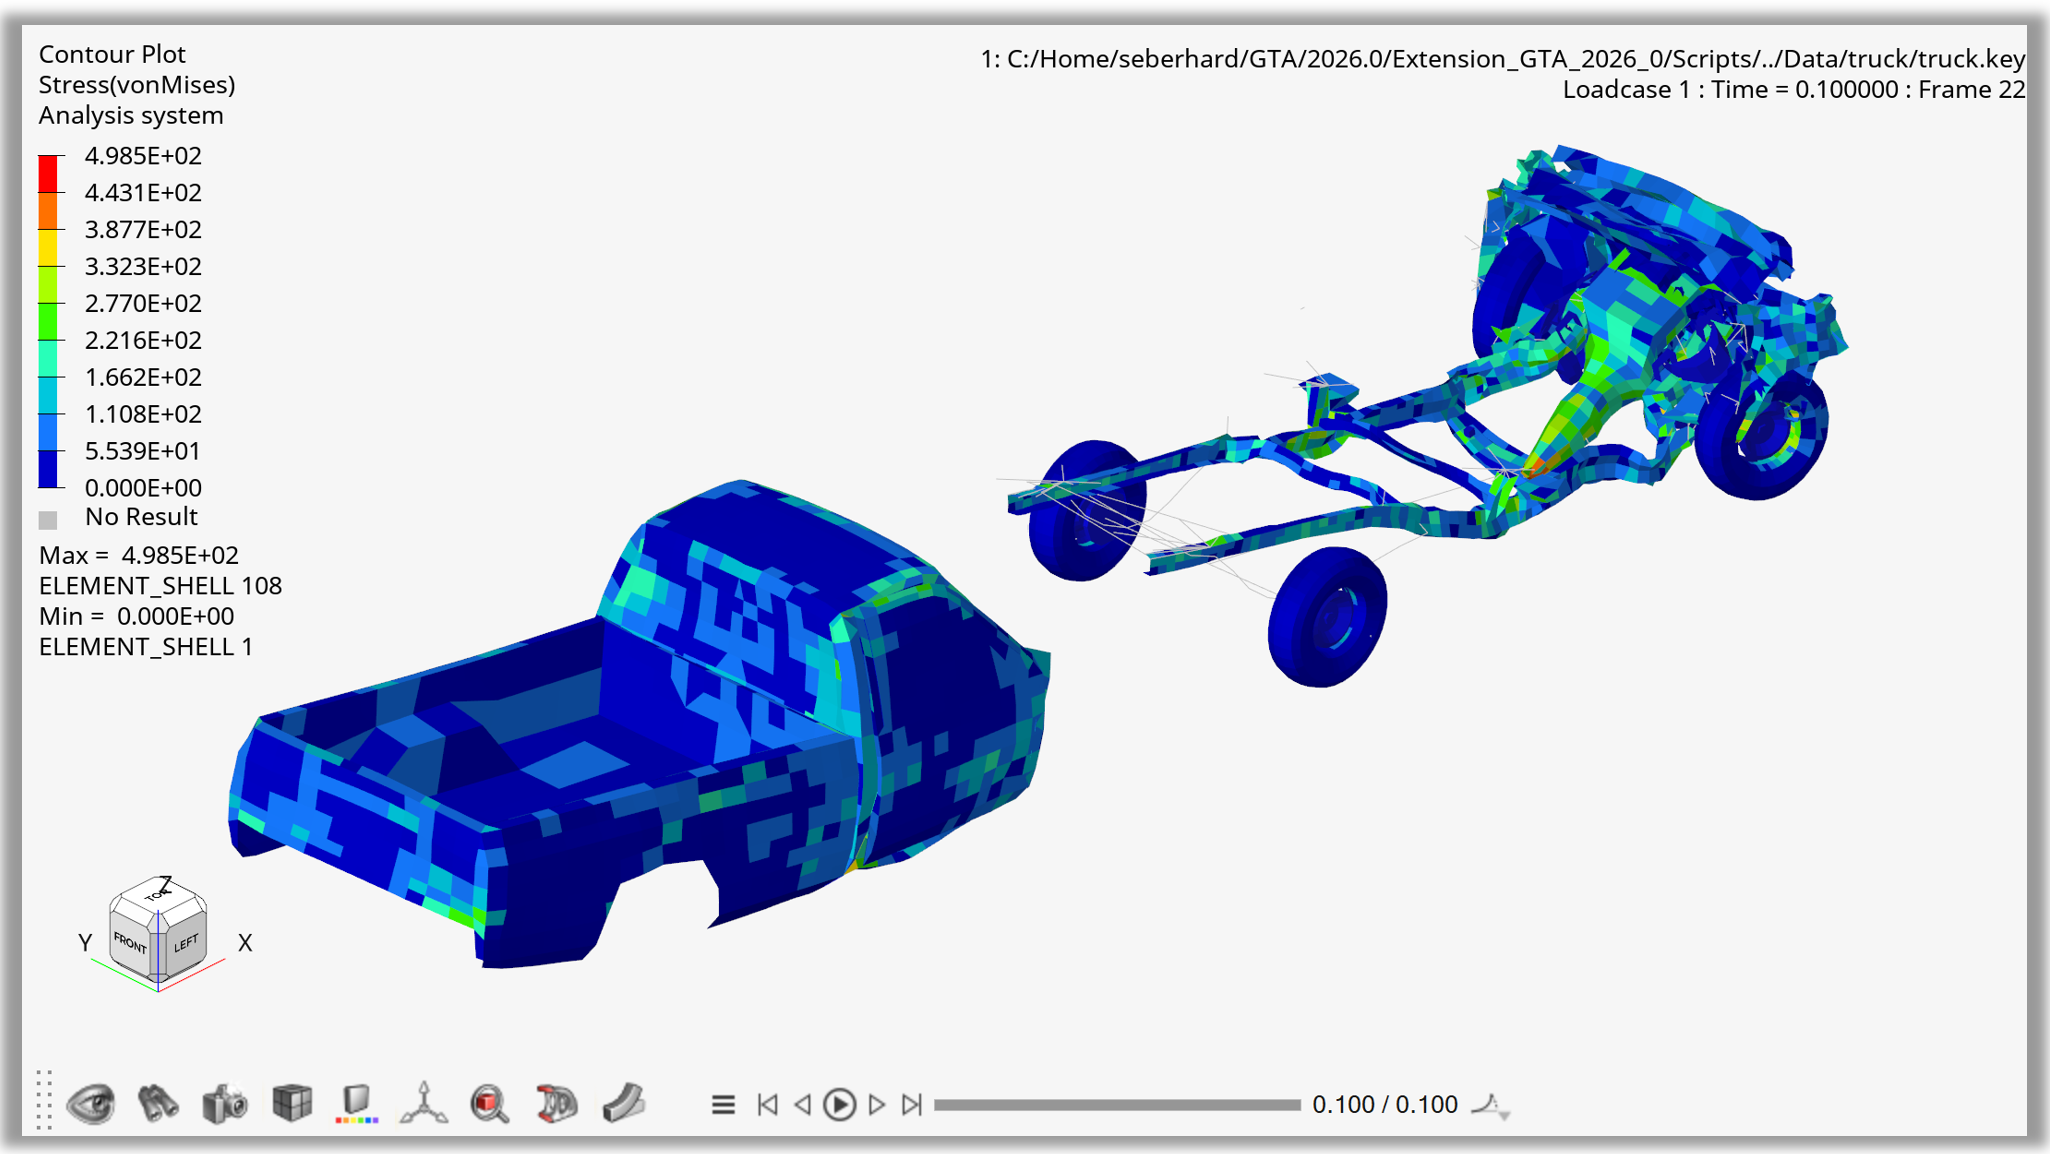
Figure 12. Explosion Translate Parts