Efficiency map
Positioning and objective
The aim of the test “Performance mapping – Sine wave – Motor – Efficiency map” is to characterize the behavior of the machine in the "Torque-Speed" area.
Input parameters like the maximum “Line-Line voltage”, the maximum “line current” and the desired “Maximum speed” of the machine are considered.
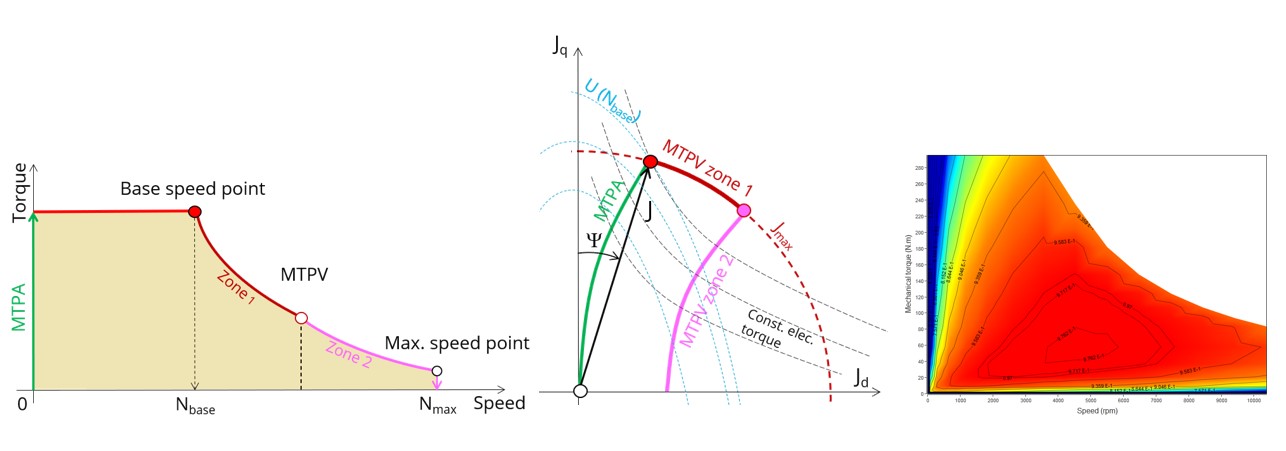
Two types of command modes are available: The Maximum Torque Per Volt command mode (MTPV) and the Maximum Torque Per Amps command mode (MTPA).
Input parameters define torque-speed area in which the evaluation of the machine behavior is performed.
In the results, the performance of the machine at the base point (base speed point) and for the maximum speed set by the user are presented.
A set of curves (like Torque-Speed curve) and maps (like Efficiency map) are computed and displayed.
Note: In addition, in Jd-Jq plane, a graph shows the computed working points for the torque speed curve.
The iso-electromagnetic torque, the iso-current and the iso-voltage are also displayed in Jd-Jq plane.
These results help the user to understand the possible performance of the machine in its electric environment.
Several features are available in this test.
The second feature allows the user to define a duty cycle by giving a list of working points (speed, torque) versus the time. The displayed results illustrate the machine performance over the considered duty cycle (mean, min, and max values).
The following table helps to classify the test “Performance mapping – Sine wave – Motor – Efficiency map”.
| Family | Performance mapping |
|---|---|
| Package | Sine wave |
| Convention | Motor |
| Test | Efficiency map |
Subsections
Inputs
For more details, please refer to Inputs.
Thermal
For more details, please refer to Thermal.
Electronics
For more details, please refer to Electronics.
Mechanics
For more details, please refer to Mechanics.