Block Category: Nonlinear
Inputs: Floating- or fixed-point values. If you index in with fixed point, Embed automatically converts to fixed point with optimal scaling. You always enter the table data in floating point.
Description: The map block can be used for static function approximation with measured data, or it can be used for device calibration, such as thermocouple-voltage-to-temperature conversion.
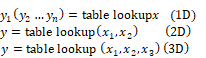
The map block performs piecewise linear interpolated 1- 2-, and 3-dimensional table look-ups. You can set up a look-up table or change an existing one through the map block or by using the Lookup Table wizard.
The types of data that can be used by the map blocks are:
•Data files (DAT)
•Comma separated text files (CSV)
•Binary matrix, ASCII matrix, and general text data files (M, MAT, and TXT)
•8-bit or 16-bit audio files (WAV)
•Excel spreadsheets (XLSX)
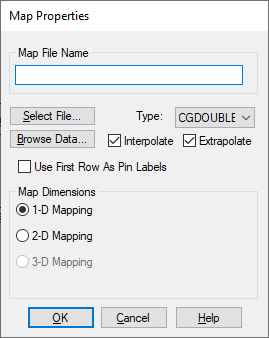
Extrapolate: Allows dependent variables to be linearly extrapolated for values beyond the bounds of the table using the last two data points in the table. This feature can be used for static function approximation with measured data or for device calibration, such as thermocouple-voltage-to-temperature conversion.
Interpolate: Allows dependent variables to be linearly interpolated for independent variable values between data points. This feature can be used for static function approximation with measured data or for device calibration, such as thermocouple-voltage-to-temperature conversion.
1-D Mapping: A one-dimensional map file has one independent variable, but can have from one to 16 dependent variable outputs. The first column is an independent variable range. The numbers in the independent variable column must be either increasing in order or decreasing in order, but not both. Each additional data column you supply in the map file yields an additional dependent variable. Use Edit > Add Connector to add an output connector for each dependent variable column in the resulting map block.
The numbers to the right of 1-D Mapping refer to the dimensionality and range of the map vector. For example, 10x1[1:100] represents a 1D table with 10 elements ranging from 1 to 100.
Lines that are prefaced with a semi-colon (;) are treated as comments.

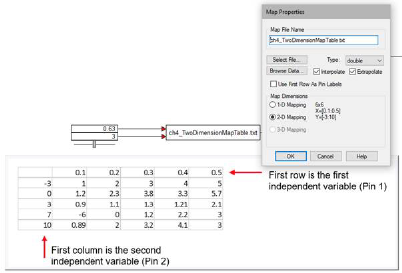
2-D Mapping: A two-dimensional map file has two independent variables and one dependent variable output. The first row contains the domain points for the first independent variable; and the first column (excluding the column member in row 1) represents the second independent variable. The position (1,1) must be left blank.
Like one-dimensional mapping, the independent variable values must be either monotonically increasing or decreasing.
Lines that are prefaced with a semi-colon (;) are treated as comments.
The numbers to the right of 2-D Mapping refer to the dimensionality and range of the map vector. For example, 10x50[10:20, -10:10] represents a 2D table with 10 columns and 50 rows, where the minimum column is 10, the maximum column is 20, the minimum row is -10, and the maximum row is 10.
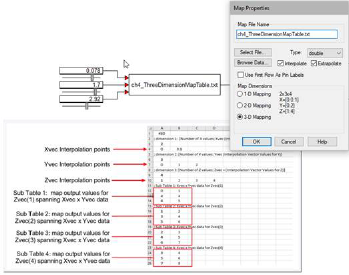
3-D Mapping: A
three-dimensional map file has three independent variables and one dependent
variable output. The format of the first seven lines is as follows:
1:
Starts with #3D
2: Number of look-up values for dimension 1
3: Look-up
values for dimension 1 (vector)
4: Number of look-up values for dimension
2
5: Look-up values for dimension 2 (vector)
6: Number of look-up values
for dimension 3
7: Look-up values for dimension 3 (vector)
Lines 8 through n are elements of dimension 3 matrices of (dimension 1 columns) * (dimension 2 rows). Lines that are prefaced with double hyphens (--), double slashes (//), or commas (,) are treated as comments.
Dependent variables are linearly interpolated for independent variable values between map points, and linearly extrapolated for values beyond the bounds of the table using the last two points in the table. This feature can be used for static function approximation with measured data or for device calibration, such as thermocouple-voltage-to-temperature conversion.
Map File Name: Specifies the name of the map file, or click Select File to select it. Map files can be DAT, CSV, M, MAT, TXT, WAV, or XLSX files. To open the specified file with the default text editor, click Browse Data.
Use First Row As Pin Labels: If the first row in the data file is text, you must activate the Use First Row As Pin Labels. When activated, the text is used as labels on the block connectors.
Examples of the map block are under Examples > Blocks > Nonlinear.