Predict Real-Time
Predict real-time output value by changing the input value.
Note: To reset the simulation, click option in the Setup tab. The
Hard Refresh option will purge the current data and
reset to the beginning.
Predict real-time output values by changing the input values using the What-If analysis method.
-
Click Predict to view the Model Quality values.
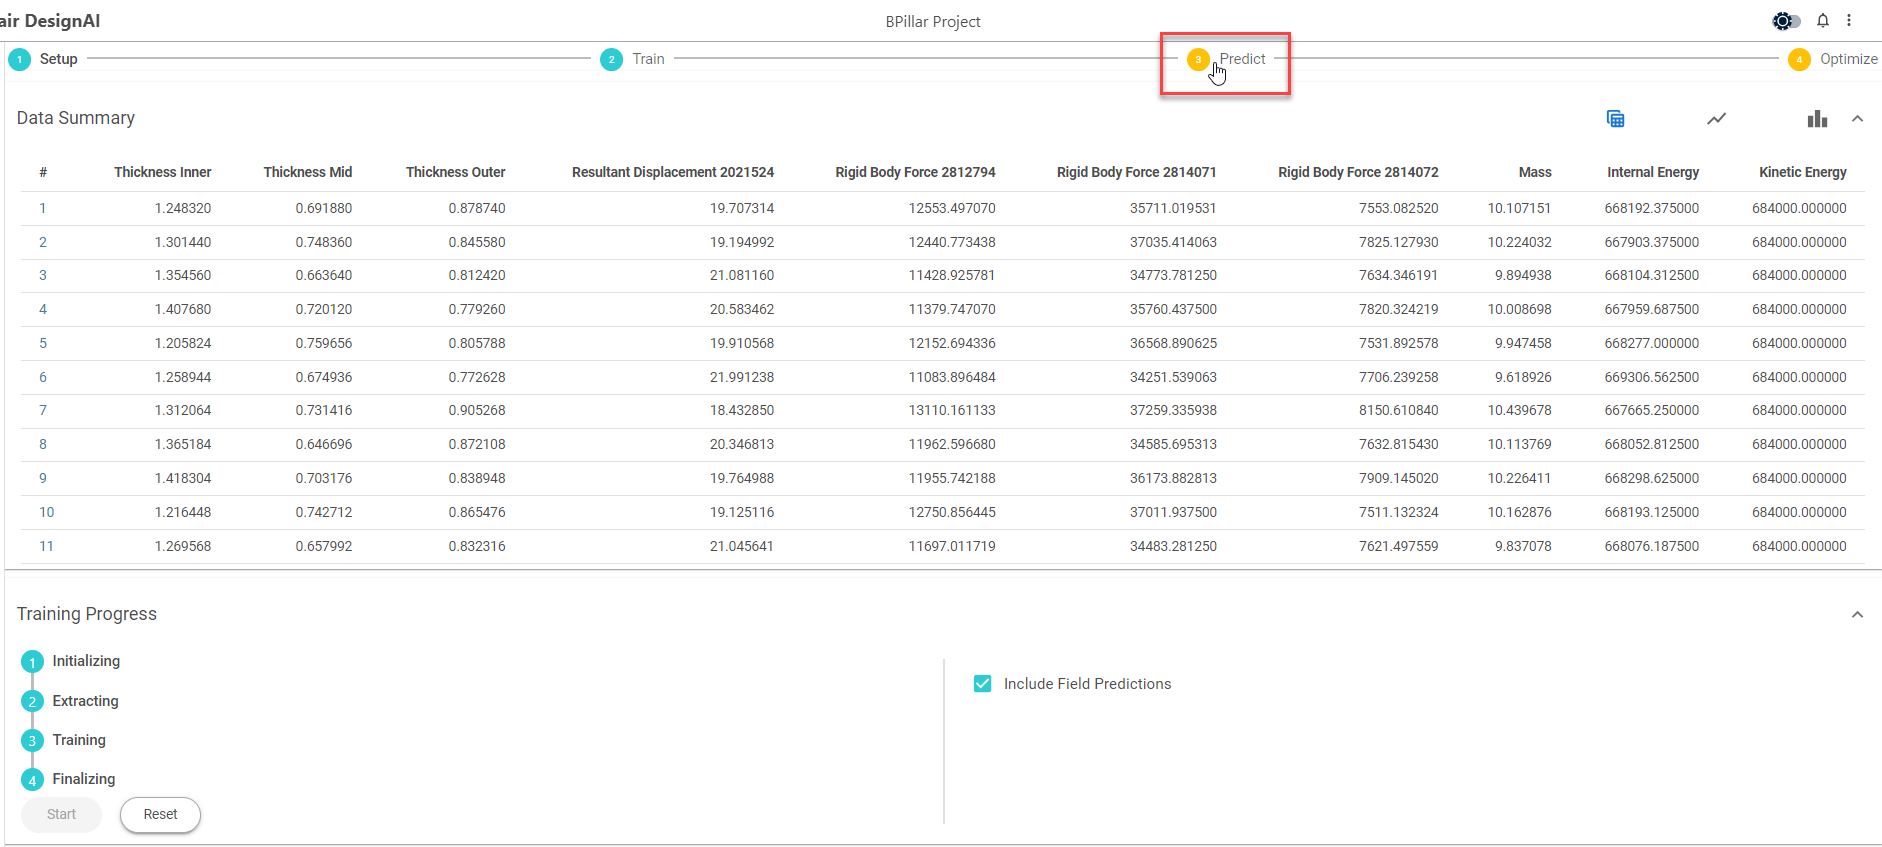
Figure 1. Predict Real-TimeThe Model Quality and Predict values are displayed.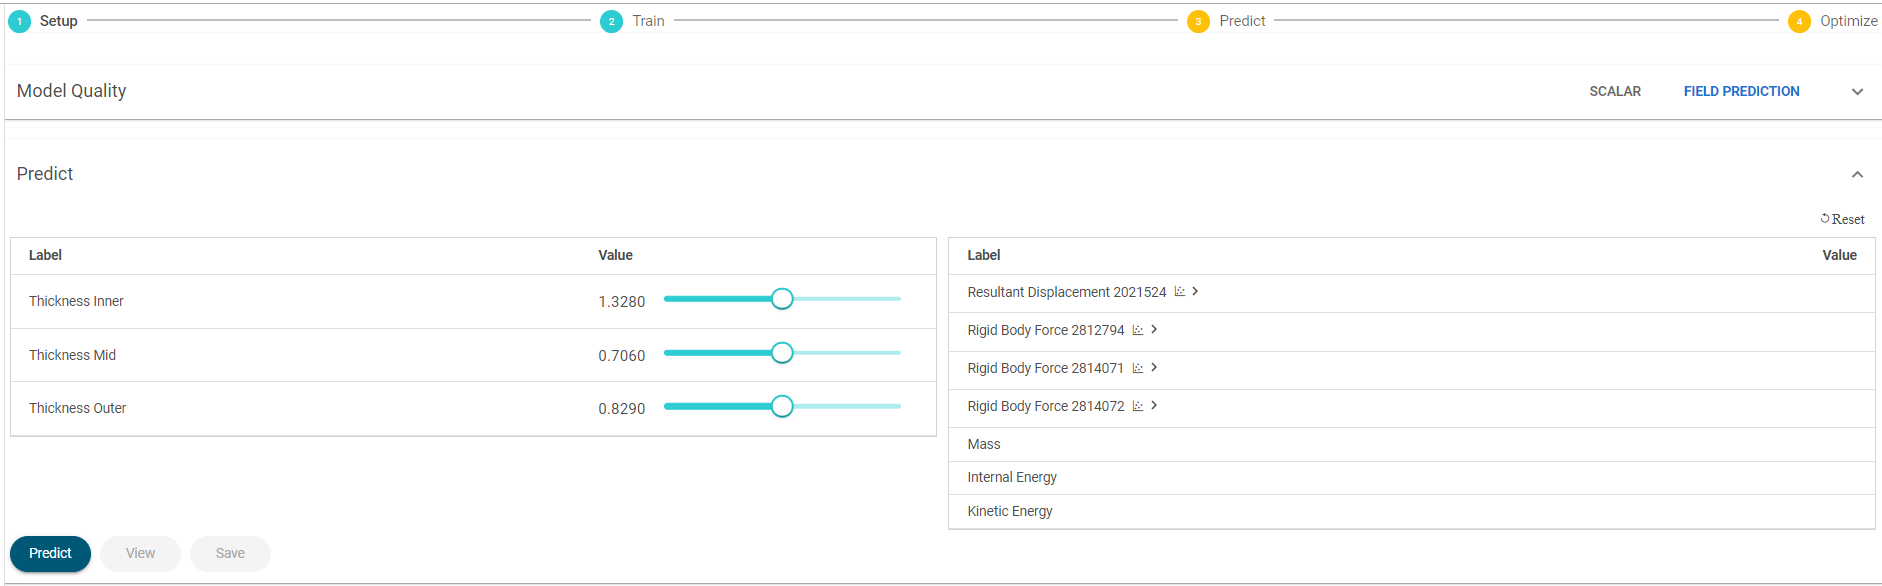
Figure 2. Predict Real-Time Information -
Click
 next to Model
Quality to view its values.
next to Model
Quality to view its values.
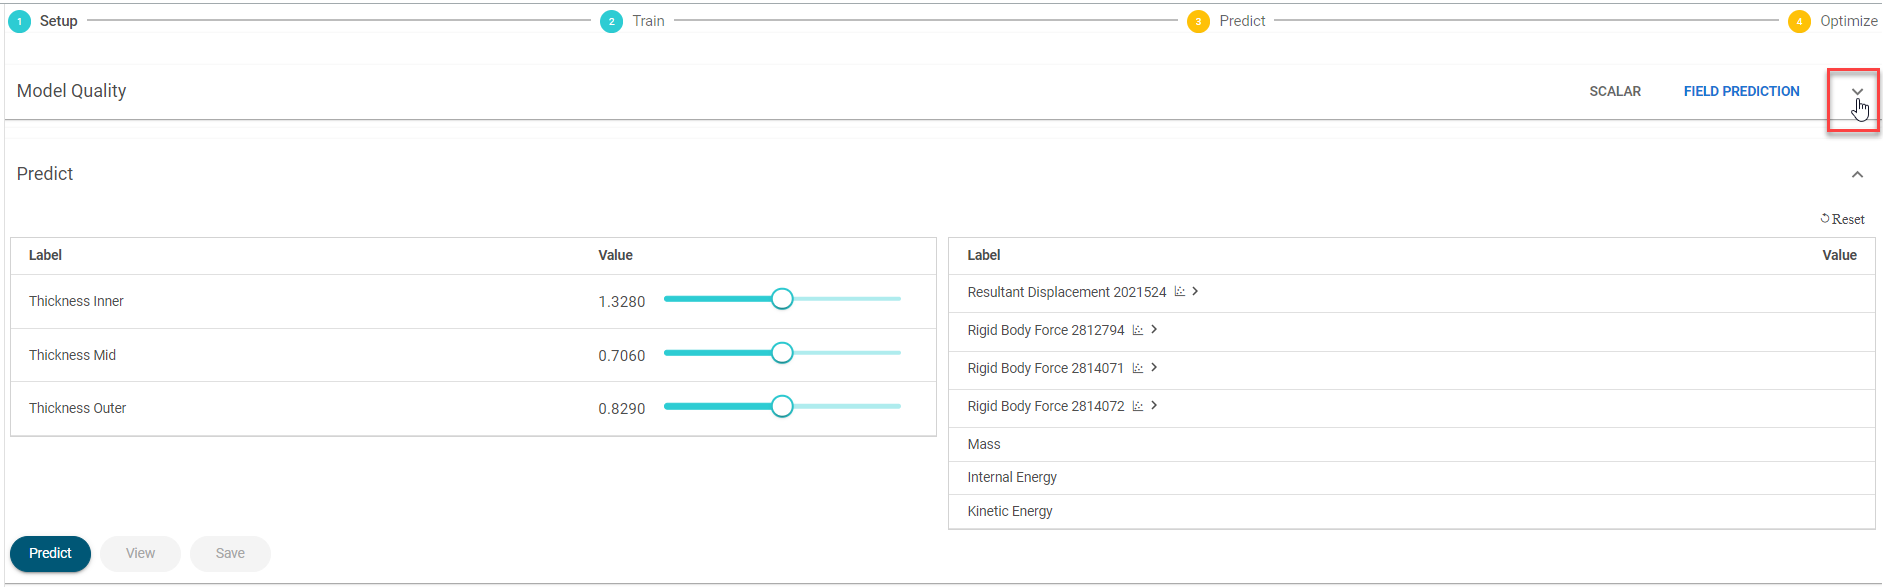 Figure 3. Model QualityThe model field prediction values are displayed.
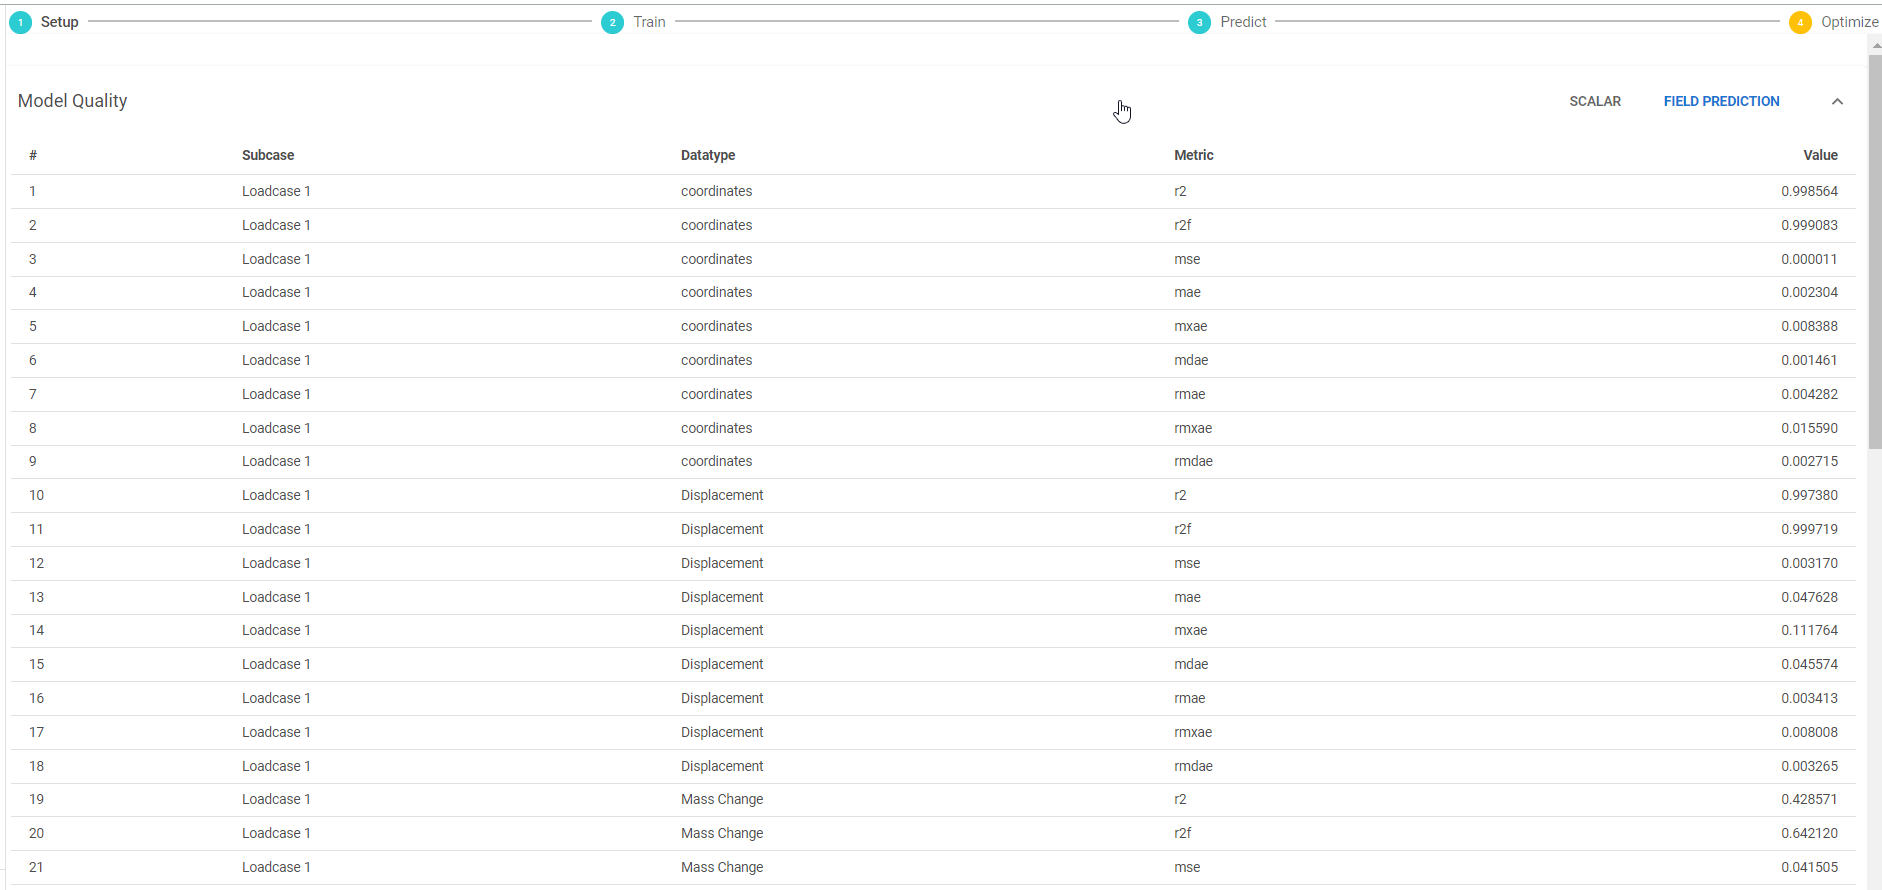 Figure 4. Model Quality - Field Prediction ValuesThe field prediction metrics and its description are as follows:
- r2 (coefficient of determination) - Generally has a useful lower bound of zero. < 0 indicates a simple mean would provide better predictions. The desired value limit is 1 and the range is [-inf,1]
- r2f (flattened coefficient of determination) - Generally has a useful lower bound of zero. < 0 indicates a simple mean would provide better predictions. Flattening done over time axis. The desired value limit is 1 and the range is [-inf,1]
- mse (mean square error) - The desired value limit is unit^2 and the range is [0,inf]
- mae (mean absolute error), mdae (median absolute error), and mxae (maximum absolute error) - The desired value limit is 0 and the range is [0,inf]
- rmae (relative mean absolute error), rmdae (relative median absolute error), and rmxae (relative maximum absolute error) - Normalized relative to the observed range (max-min). The desired value limit is 0 and the range is [0,inf]
-
Click Scalar to view the details.
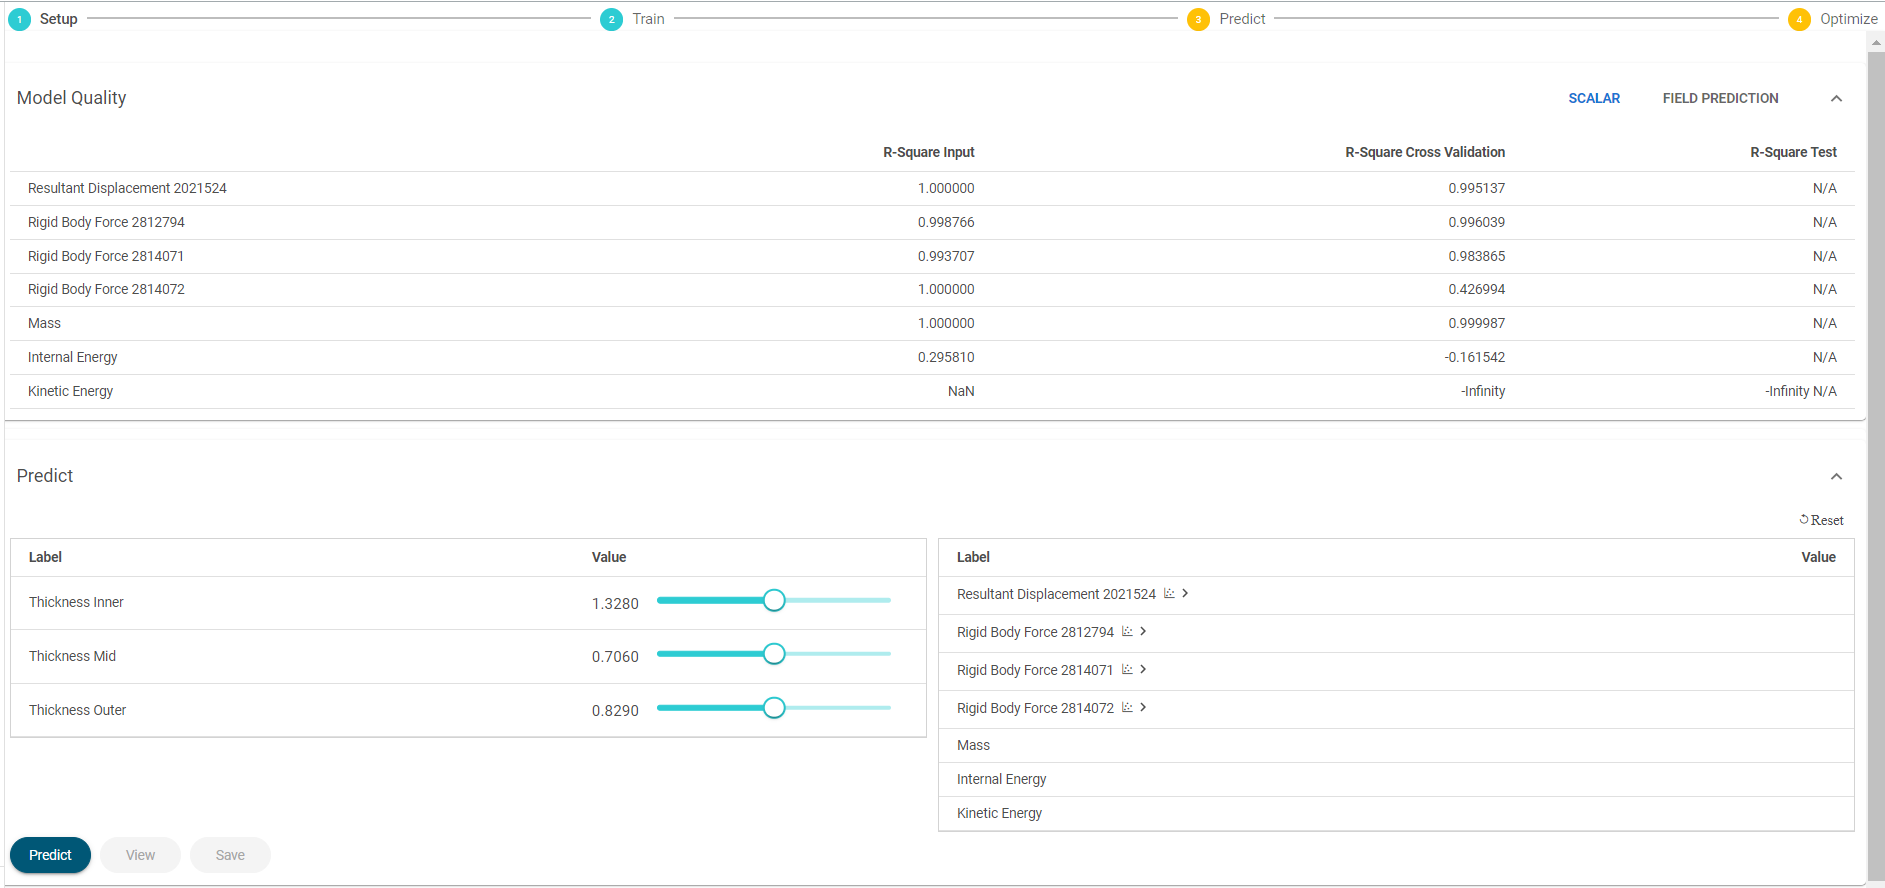 Figure 5. Model Quality - Scalar Values
R-Square is a measure of the quality of the machine learning model. If the R-Square value is close to 1.0, the model is more accurate in predicting known data points. You can proceed with Predict Study or Optimization if R-square values are greater than 0.7. The values in the R-Square Test column are the most accurate indicators. In the absence of R-Square Test values, the values from the R-Square Cross Validation column can be used.
-
Click Predict to view the predict real-time output
values.
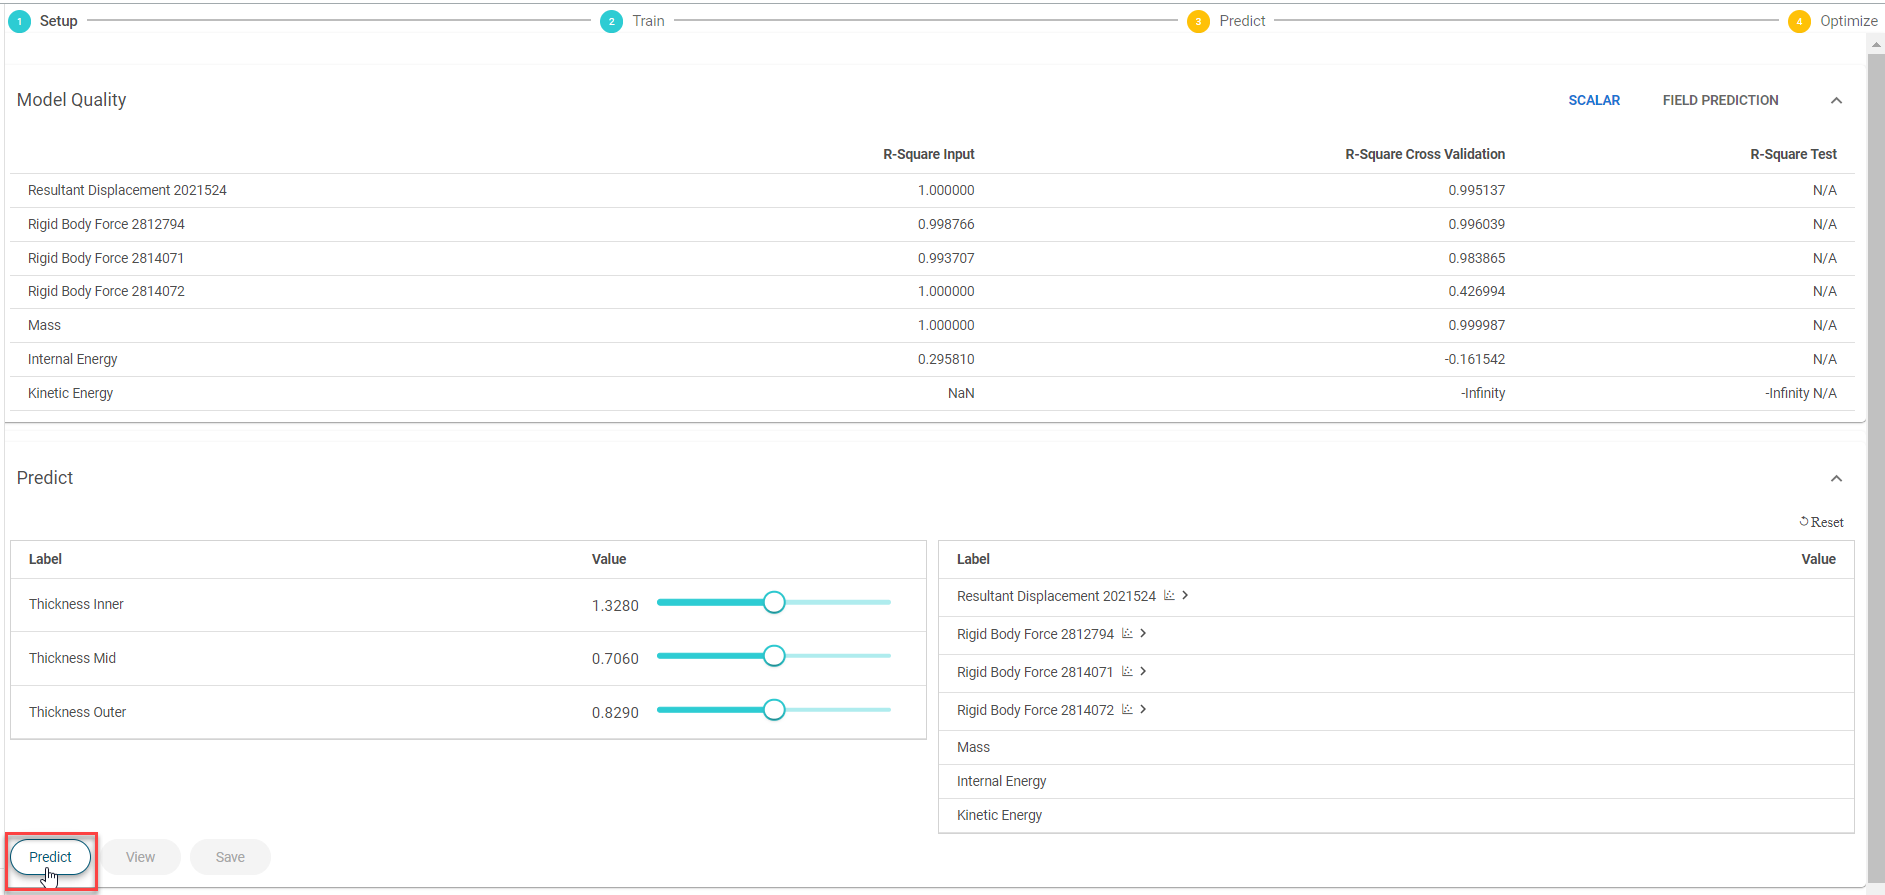 Figure 6. Predict Real-Time ValuesThe output values are displayed.
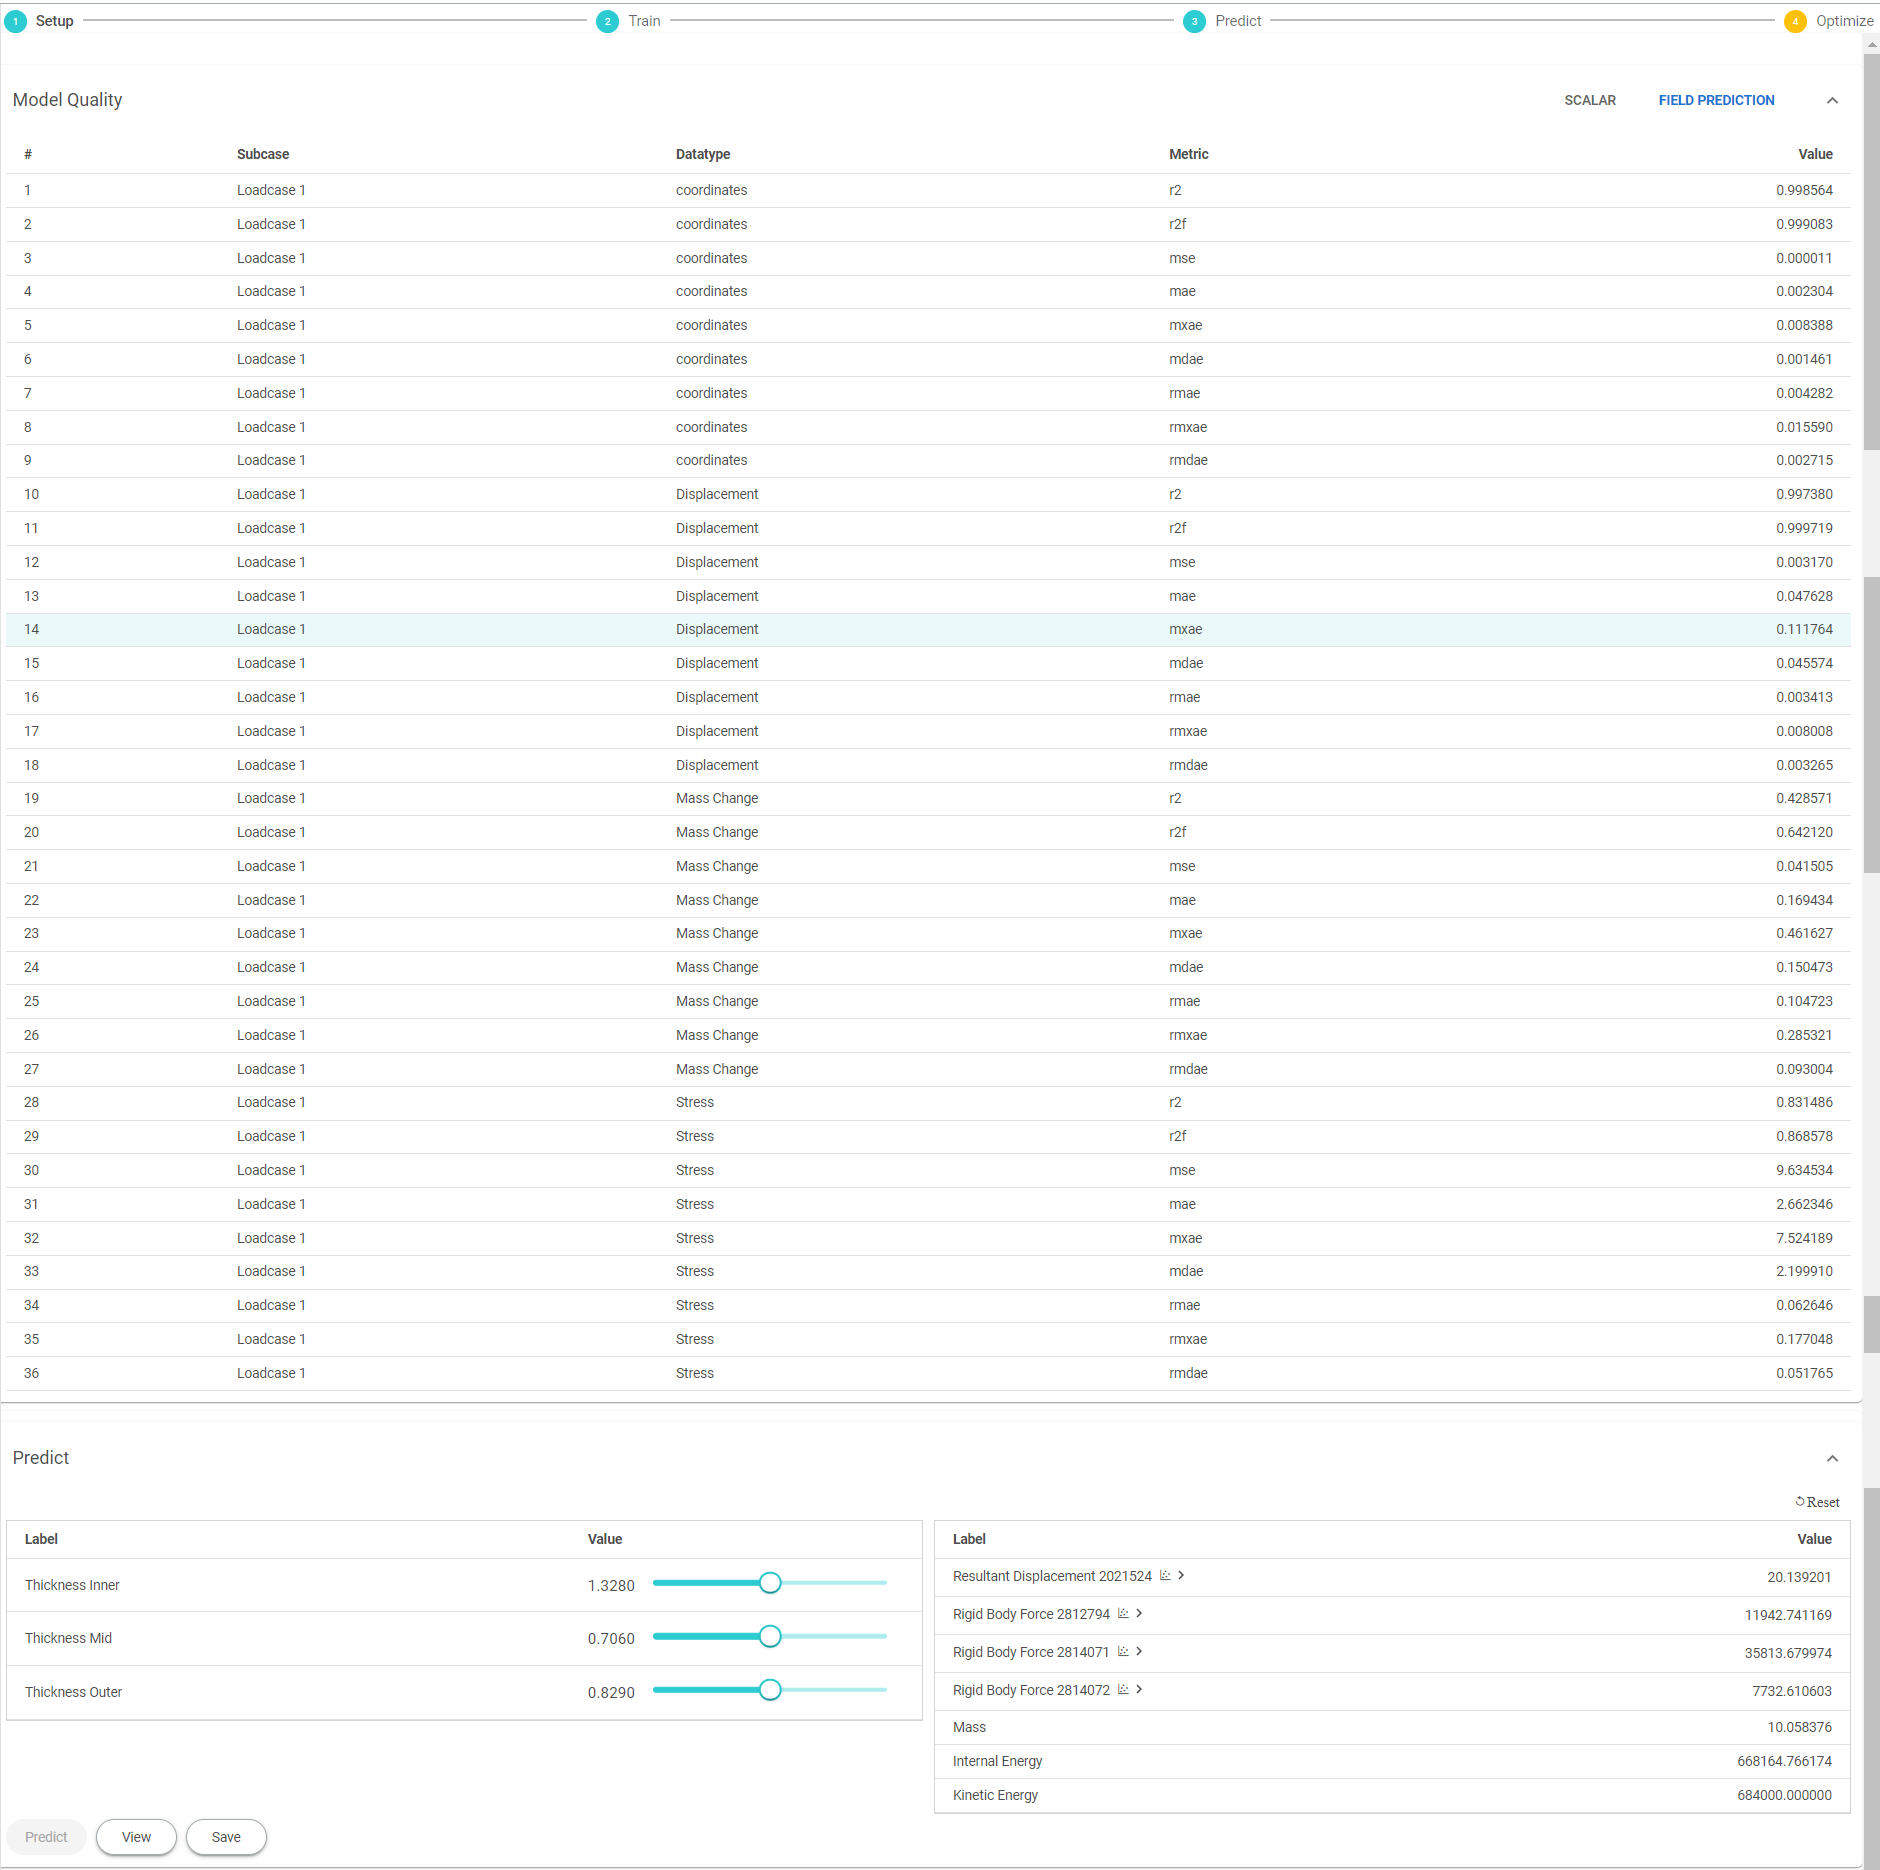 Figure 7. Predict Real-Time Output Values
 -
Click
 in the output to display the
curve.
in the output to display the
curve.
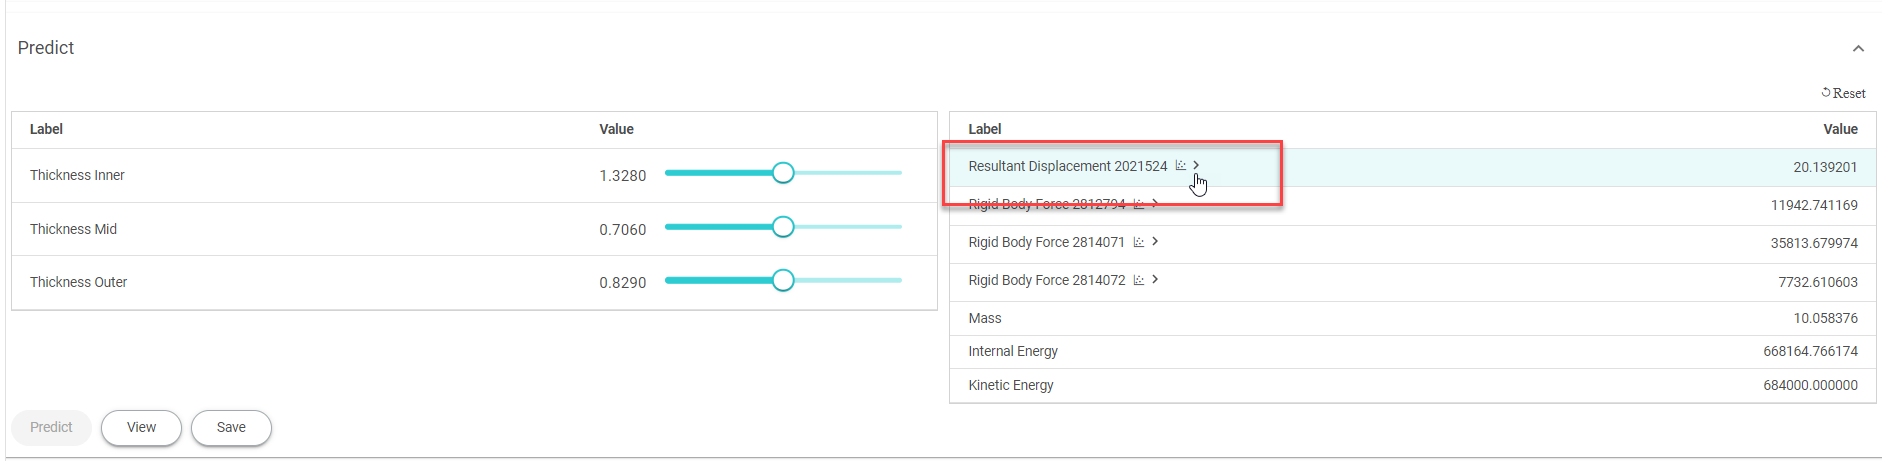
Figure 8. Curve PredictionThe curve for the output is displayed.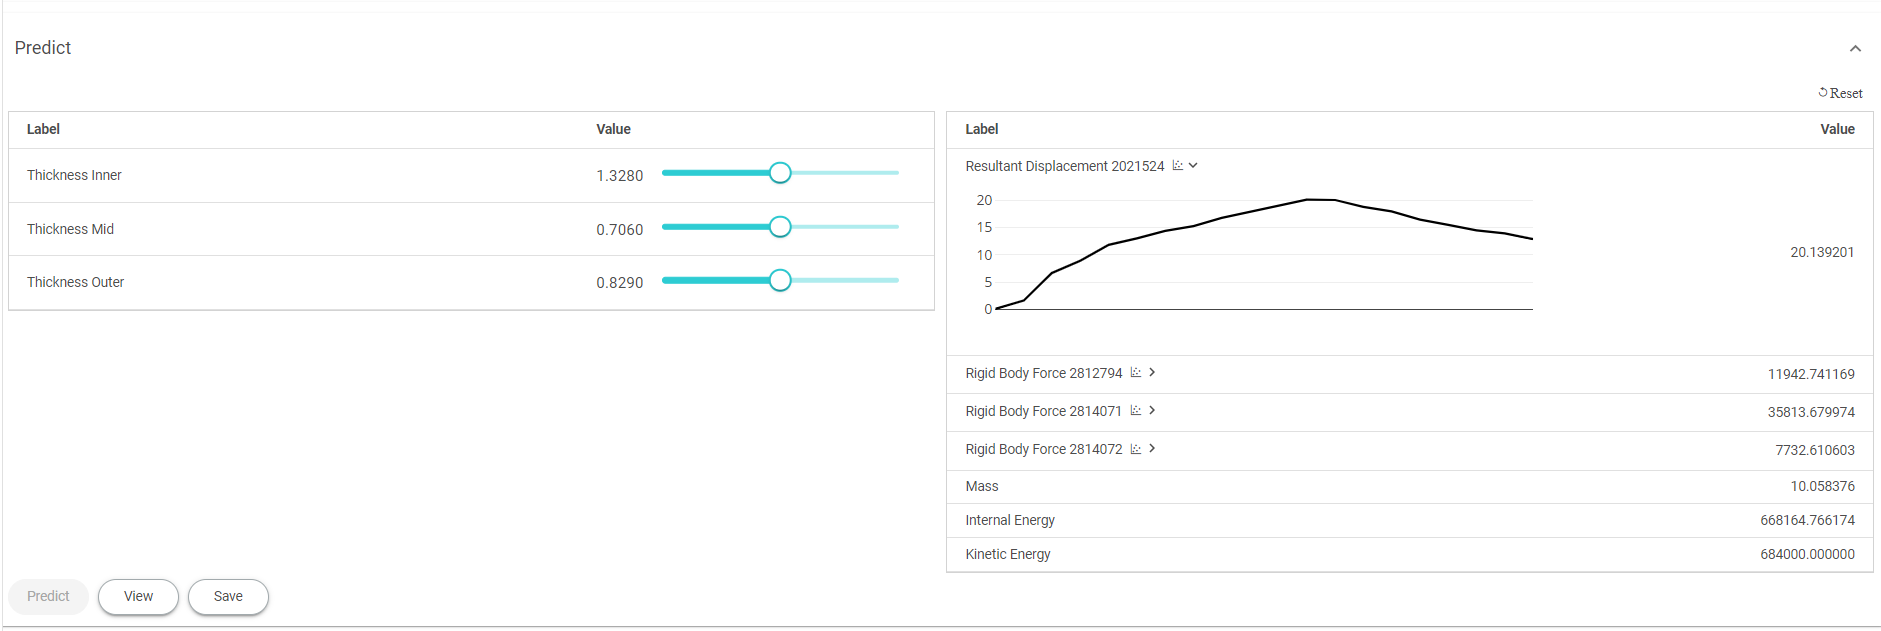
Figure 9. Output Curve -
Click View to view the predicted model preview.
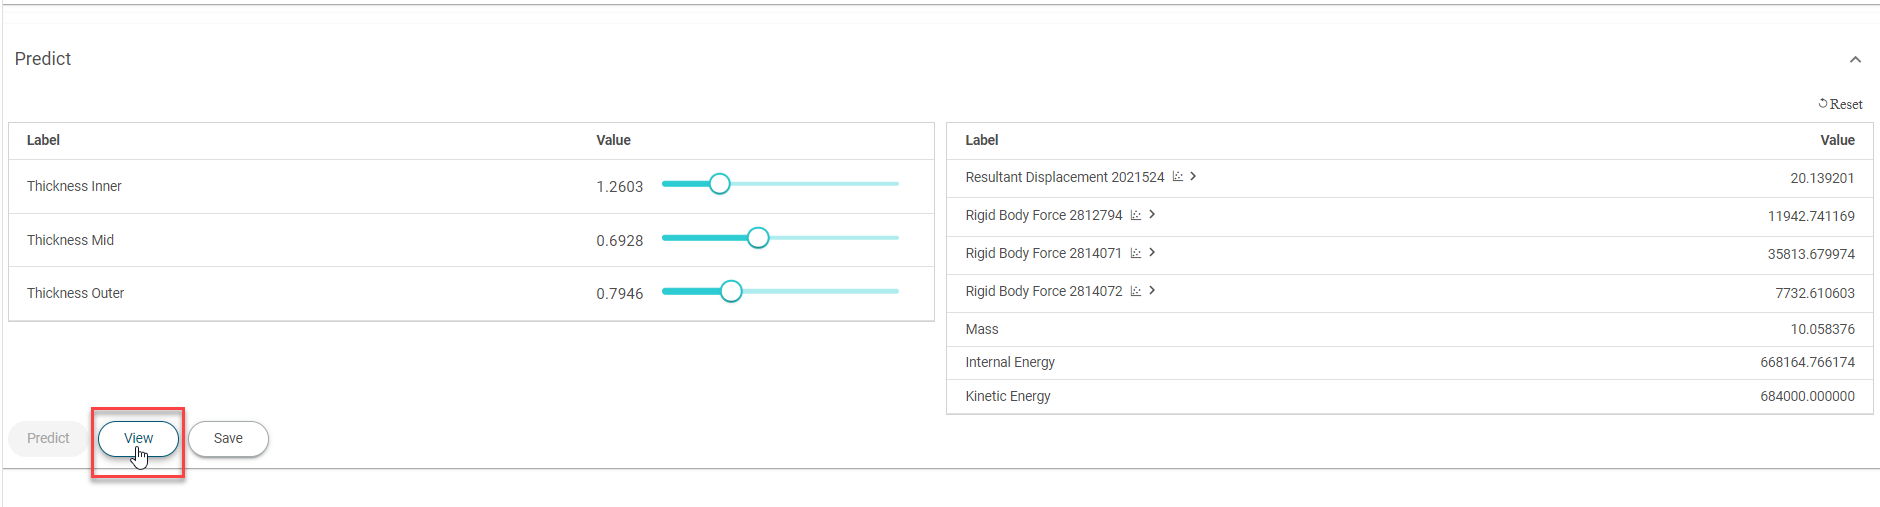 Figure 10. Predicted Model Preview - InformationThe Info panel is displayed with the predicted model preview.
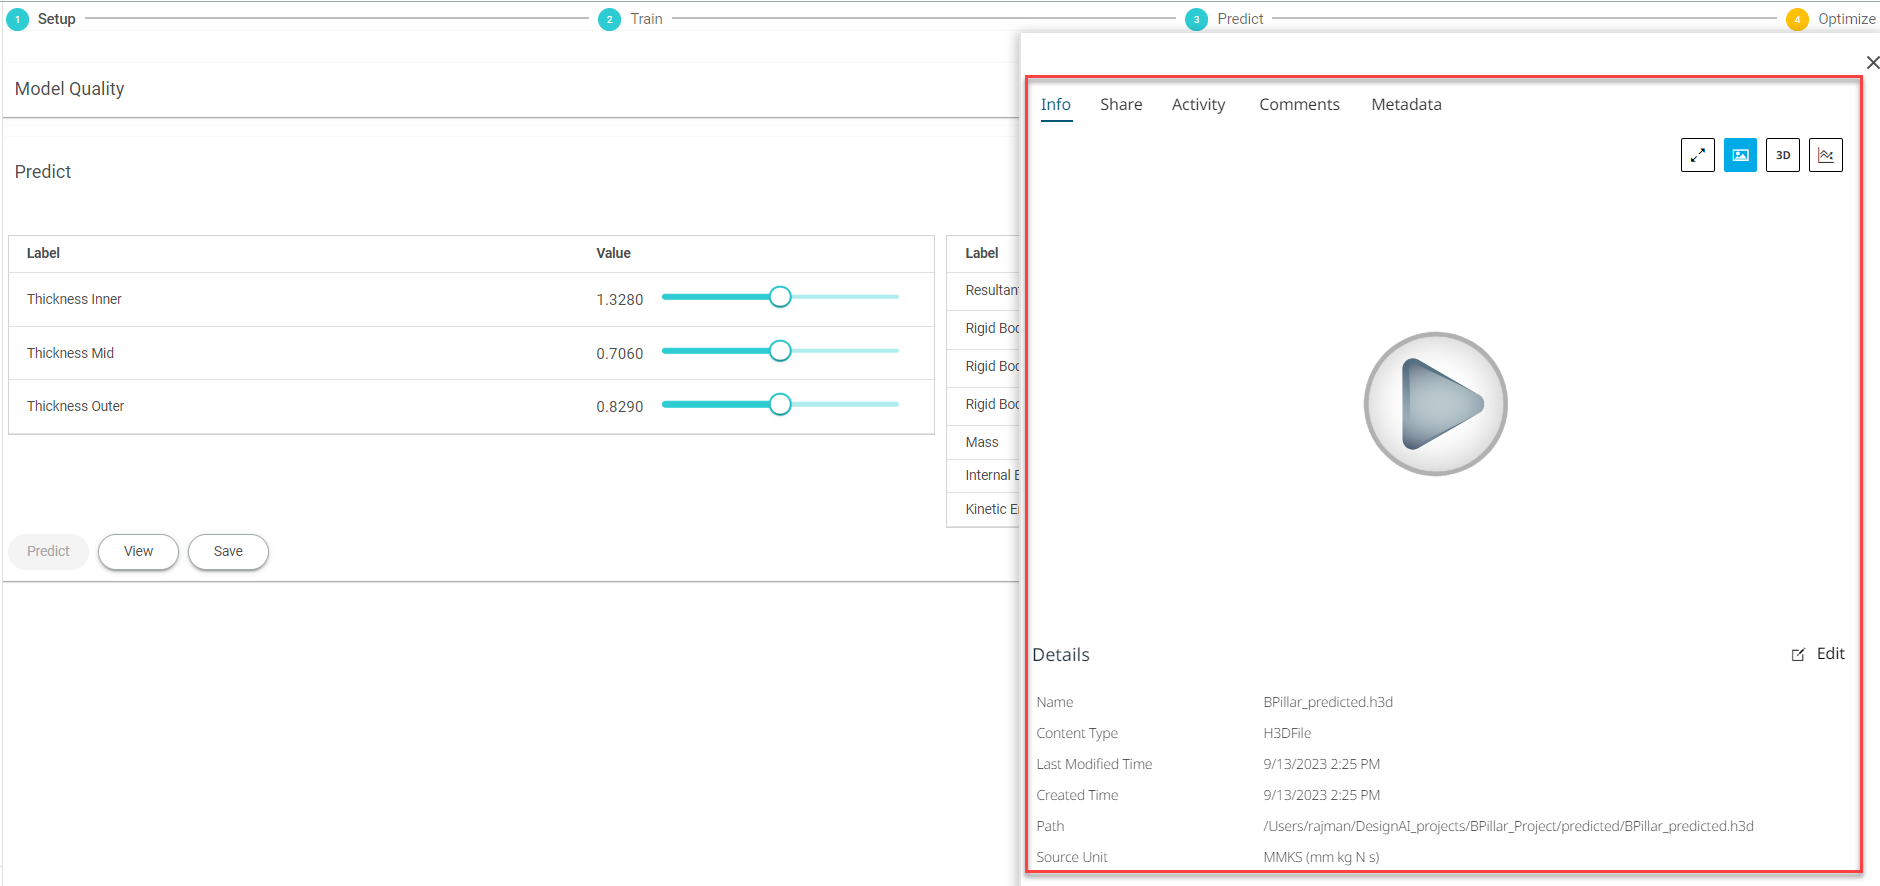 Figure 11. Predicted Model Preview - Info Panel
 -
Click the play button in the Info panel.
The predicted model preview will be generated and displayed.
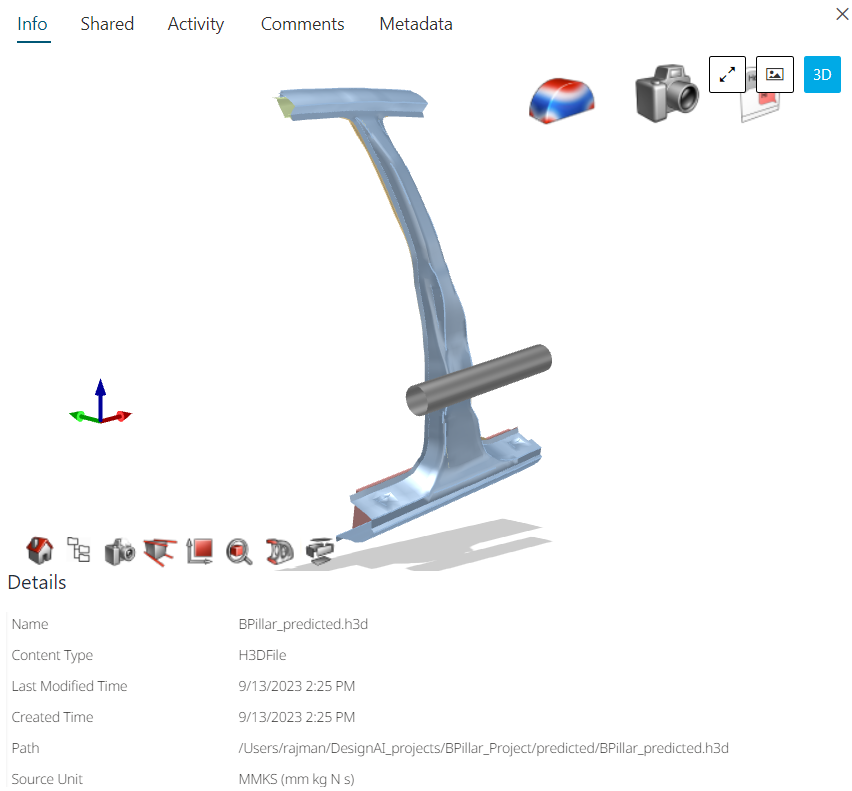 Figure 12. Predicted Model Preview - Generated Preview
 -
Click Save to save the predicted model.
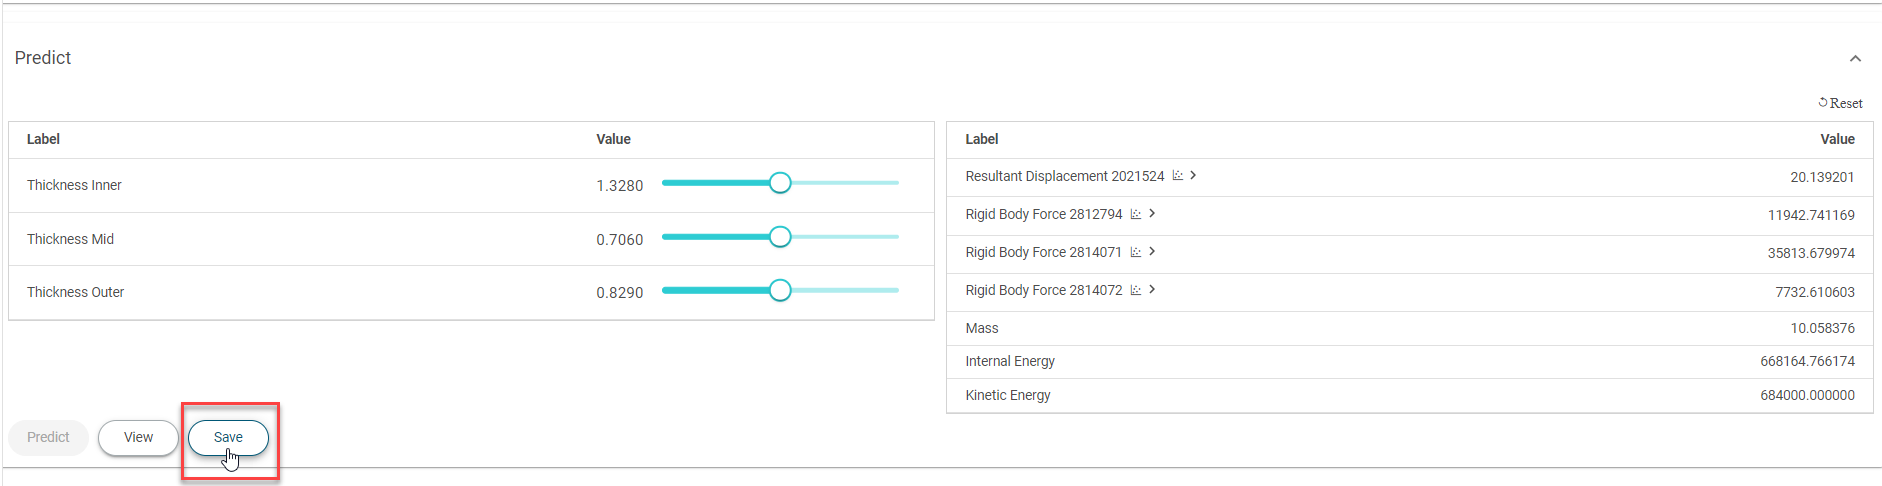 Figure 13. Predicted Model Preview - SaveThe save dialog box is displayed.
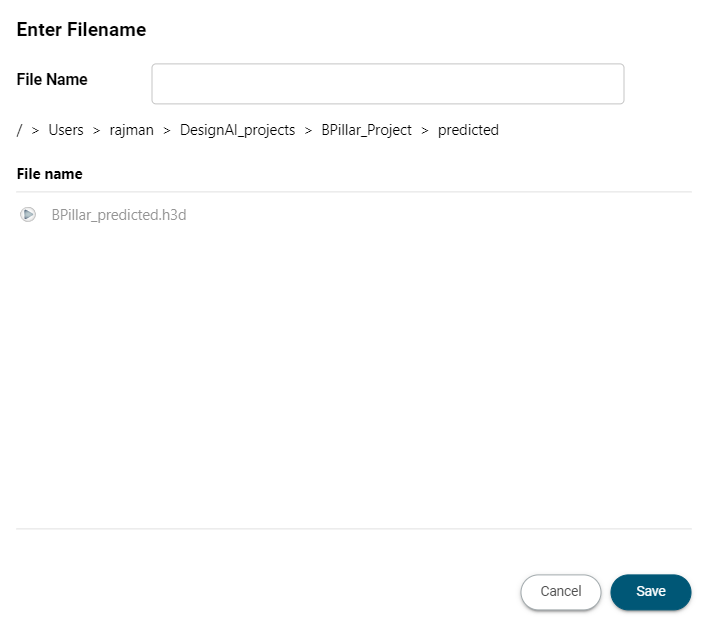 Figure 14. Predicted Model Preview - Save Dialog
 -
Slide or double click and edit the values of trained model input value in the
Predict panel to generate a new predicted
model.
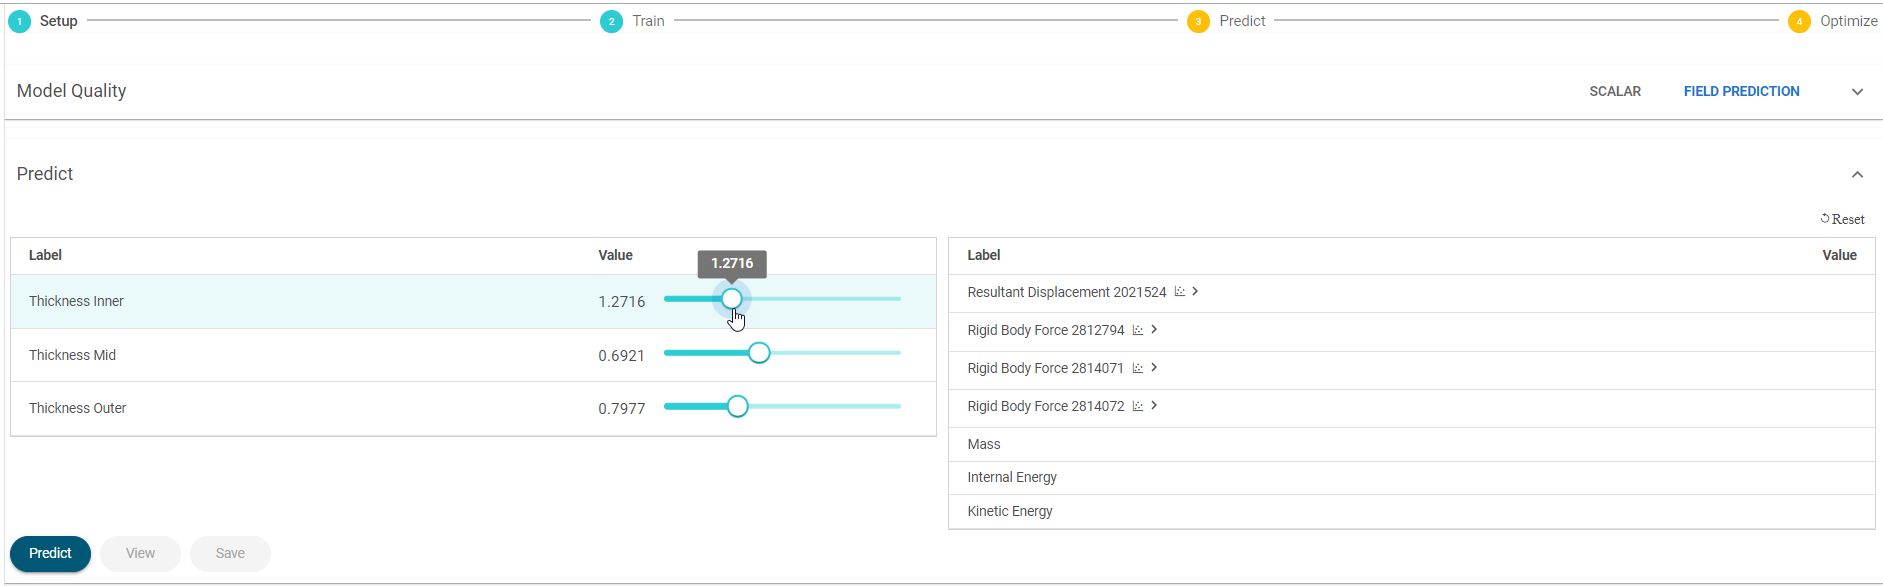
Figure 15. Predict Real-Time Values -
Click Predict to get the updated predict real-time
output values.
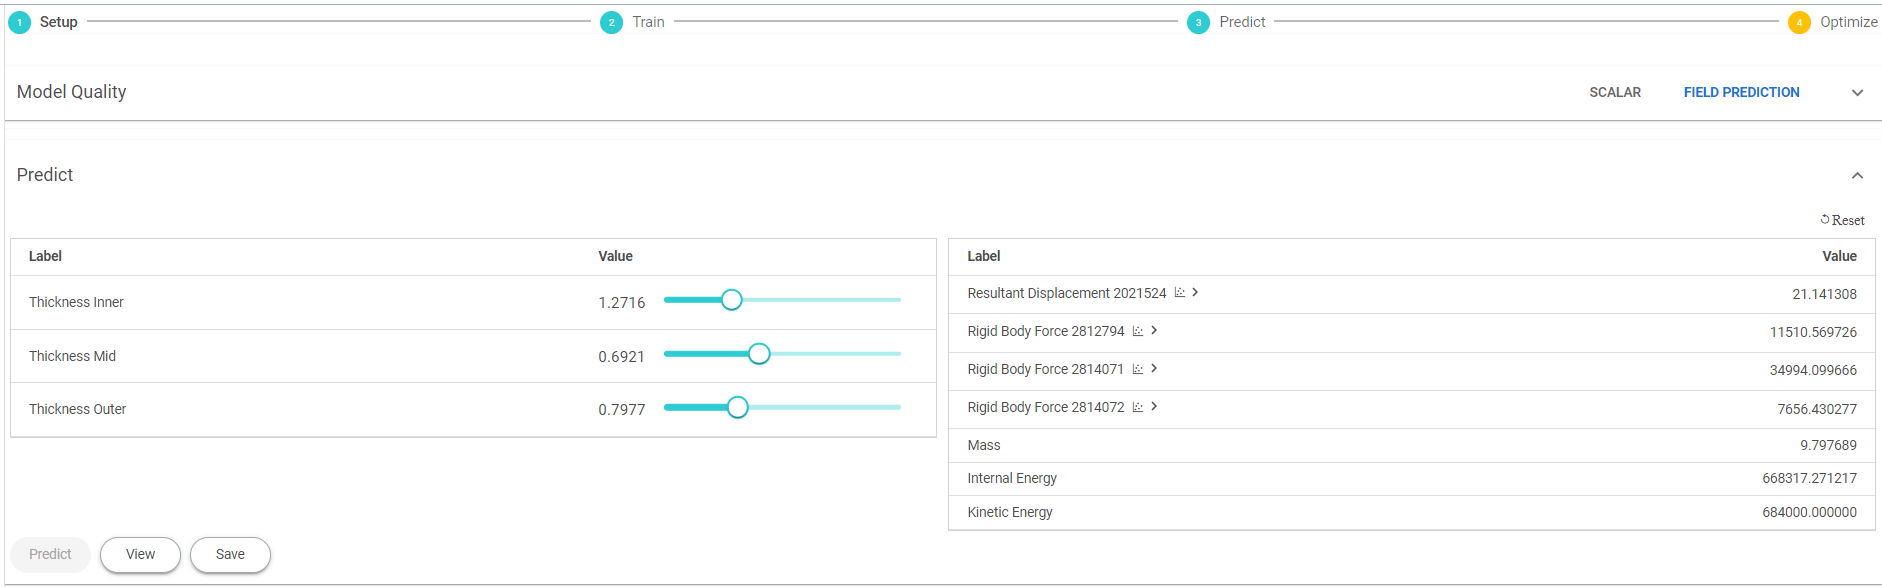 Figure 16. Predict Real-Time Updated ValuesNote: Generate multiple prediction model files by changing the input values and save them to compare the predicted model files.