bode
Bode diagram.
Syntax
bode(sys)
bode(sys, w)
bode(..., fmt, ...)
bode(..., property, value, ...)
[m, p, w] = bode(...)
Inputs
- sys
- A linear time-invariant transfer function or state space system.
- w
- A two-element vector containing the range of frequencies over which to compute the response. The units are radians/sec for continuous time, and Hz for discrete time.
- fmt
- Plot format arguments. See the plot function help.
- property
- Plot property arguments that are paired with a following value. See the plot function help.
- value
- Plot property value arguments. See the plot function help.
Outputs
- m
- The magnitude response.
- p
- The phase response.
- w
- The vector of frequencies at which to compute the response. The units are radians/sec for continuous time, and Hz for discrete time. If w is a two-element vector, it contains the range of frequencies over which to compute the response. The units are radians/sec for continuous time, and Hz for discrete time.
Example
Create the Bode diagram of a 2nd order Chebyshev II low pass analog filter with a 100 radians/sec cutoff frequency and -20 db attenuation.
[b,a] = cheby2(2,20,100,'s');
tfo = tf(b,a);
bode(tfo);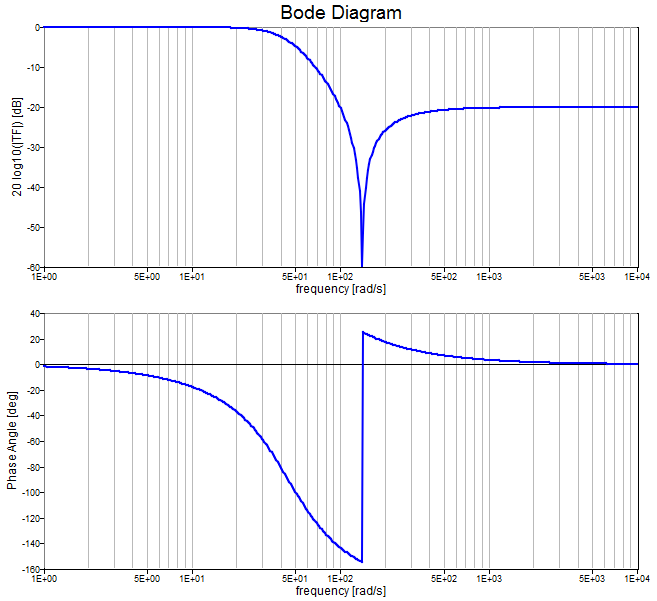
Figure 1. bode figure 1
Comments
If the output arguments are omitted, the function plots the results.
If w is omitted, then internally computed values are used.
bode does not currently support MIMO systems.
By default, 500 points are plotted. More points can be requested using the w input, in which case it is typically best to specify them with logspace.