
Run the Flow Interactively
-
You can run the flow by pressing Run in the action menu
bar in the top of the Set Viewer panel.
Nothing will happen since the very first job in the dependency graph is unable to run since its input aa is missing.
-
Create a file aa in the simple_test
directory.
% touch aaThe graph will change to show that file aa was just created. If this is not seen, make sure that the Set Viewer is actively displaying the System:nodes set by double clicking on the System:nodes choice in the Set Browser.The node for file aa is green. The rest of the nodes are purple to indicate that all those dependent elements are INVALID. Another way to see the INVALID set of nodes it to say they are ready to run.Figure 1. 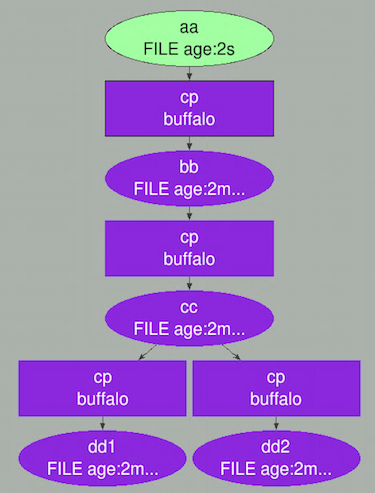
-
Click Run to have FlowTracer process
the graph.
The display will change quickly to reflect the various state changes of the nodes representing the jobs and the files.
You will see nodes change to light blue to indicate they are SCHEDULED, or yellow to indicate they are RUNNING, and finally, all of the nodes will turn bright green to show a successful run of the dependency graph. All the dependent jobs ran successfully and all dependent files were made successfully. This is just an emulation using the cp command but if the defined jobs had used production class programs, the result would be the same.