Start the Browser Interface
-
Use vovbrowser to get the URL of the project
% vovbrowser
http://your_computer_name:6407
Here you can see a few examples of what to expect when using the browser interface. The first picture shows the summary for all workspaces in the project, in this case 'integration' and 'mary'. The second image shows the report for the workspace for user 'mary'.Figure 1. The summary page shows the status of the workspaces 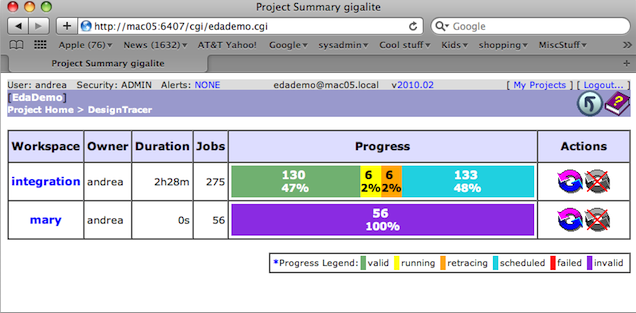
Figure 2. The user page in this EDA-Demo shows a matrix that represents the status of jobs in a specific workspace. There is a row for each block in the design and a column for each of the important jobs in the flow. The color of the cell shows the status of the job. 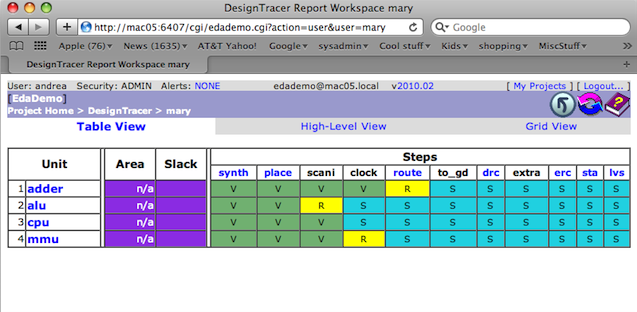
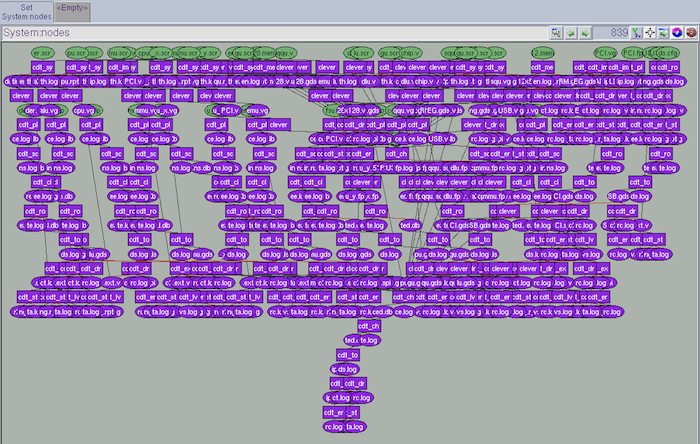
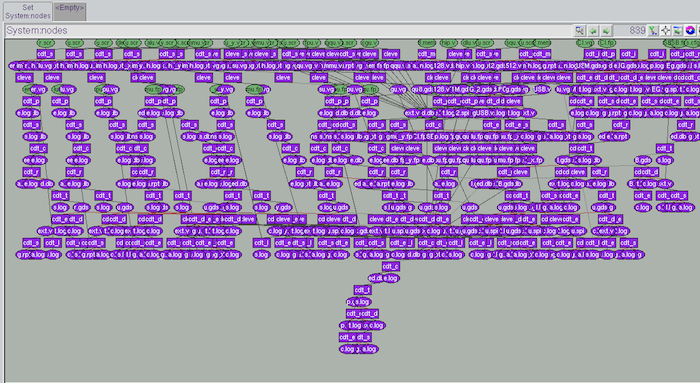
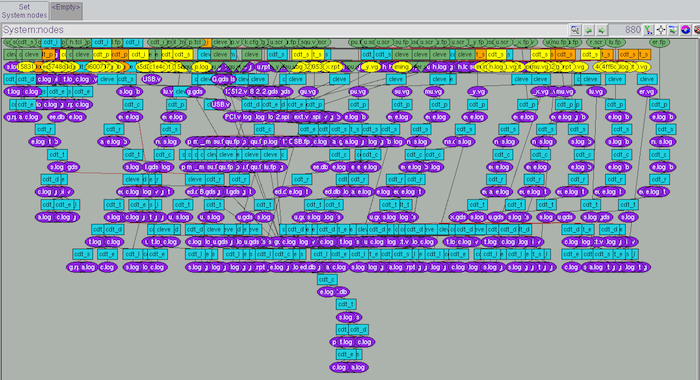
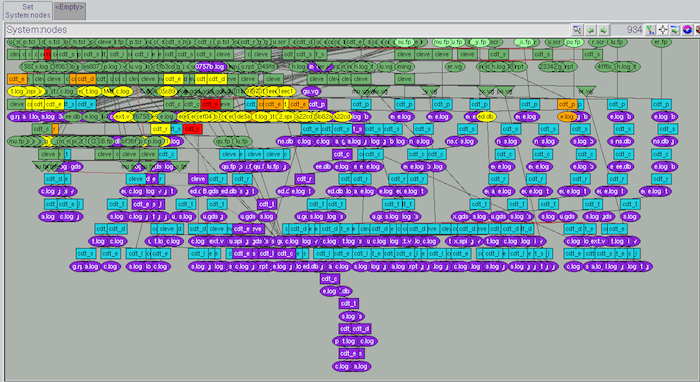
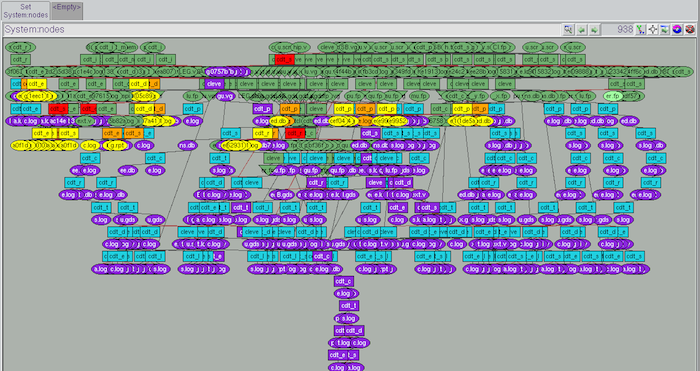
Here you can see what to expect if you use the VOV Console to run this demo. In particular, you can see the graph view for user 'integration' and the Hi-Level Flows.
Figure 3. The console shows the complexity of this flow 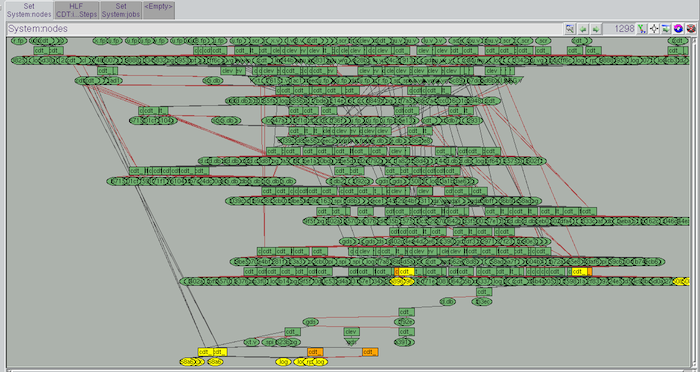
The Hi-Level Flow representation uses big blocks to represent large sets of jobs. Each block can be clicked on to expose the status of the individual jobs in the set. A little histogram on the bottom left of each block shows the status distribution of the jobs in the set.
-
From this point on, you should be able to:
- Navigate the browser interface
- Run either parts of the flow, or the whole flow
- Stop running jobs
- Monitor the execution of jobs
- Diagnose the failure of jobs
- Edi input files, check them into CVS, and check out any version of a file.