
Job Runtime - Monitor and Profile
When a job is running through a vovtasker, the tasker automatically monitors RAM and CPU utilization of the job, including all of its children.
Job statistics are sampled about once a minute. This data sampling rate does not capture jobs that complete in less time than the than the sampling period.
The MAXRAM is expressed in Megabytes (MB), where 1MB = 1<<20 bits (left-shift decimal "1" 20 times is the binary equivalent of 1 million. The CPU time is stored in ms (milliseconds), but is expressed in s (seconds).
CPU Progress and Run Status Indicators
- CPUTIME
- The total accumulated CPU time in milliseconds.
- CPUPROGRESS
- Percentage of CPU accumulated in the unit time. For example, if in 60 seconds a job uses 60 seconds of CPU time, then the CPUPROGRESS is going to be 100. This field can be 0 (zero) for jobs that are stuck: holding onto the CPU resource but not running, which makes the CPU unavailable for other jobs. This field can also be greater than 100 for multi-threaded jobs.
- LASTCPUPROGRESS
- A timestamp indicating the last time CPU usage has increased. This is used to identify stuck jobs.
- RUNSTATUS
- A descriptive text field that shows how well the job is doing. Some typical values are Good, Paging, NoCpu. The complete list of values is shown below.
| n/a | Insufficient information to determine CPU progress. Typical for jobs that have just started. |
| Good | The progress is greater than 70% |
| Medium | Progress is between 10% and 70% |
| Poor | Less than 10% CPU utilization, but no swapping of pages. |
| Paging | The progress is less than 10% and the job is swapping at a rate greater than 1000 pages per second. |
| NoCpu | The job is not accumulating any CPU time. |
| Susp | The job is suspended. |
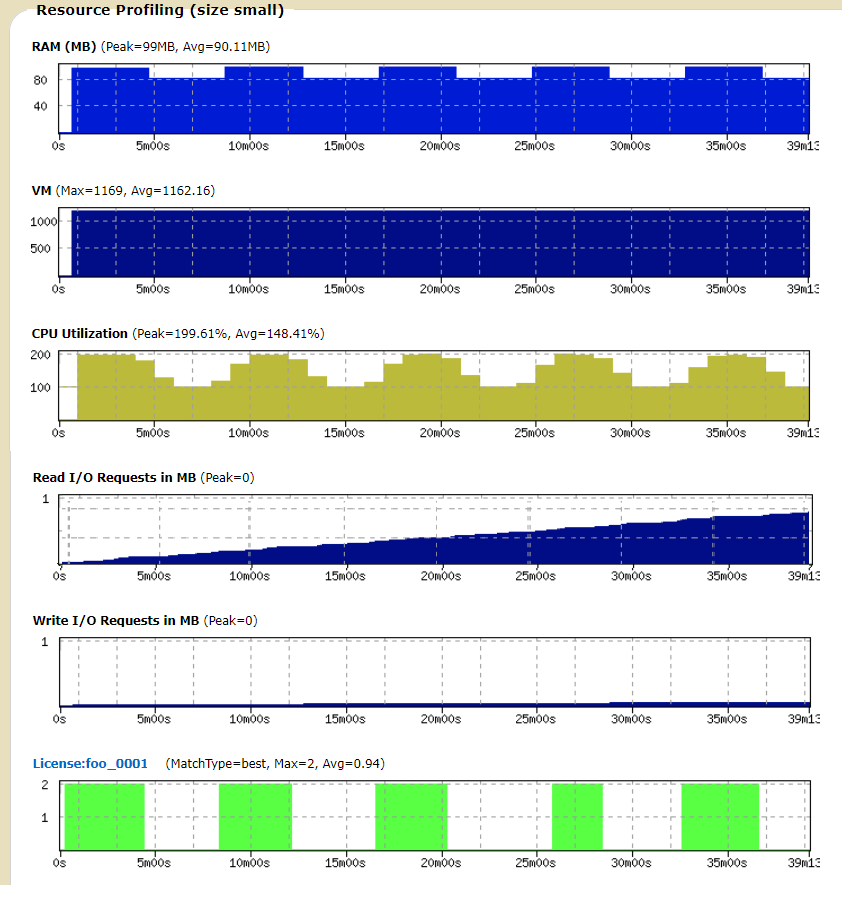
Job Profiling
When job profiling is activated, Accelerator tracks and plots performance statistics over the time the job is running.
- RAM usage
- VM size
- CPU utilization
- Cumulative Read I/O
- Cumulative Write I/O
- License checkouts (one plot per license)
% nc run -profile myJobTo view a profile, use the browser interface and visit the specific page for the job.
# In a job class definition
set VOV_JOB_DESC(profile) 1# In the file $VOVDIR/local/vncrun.config.tcl
...
set VOV_JOB_DESC(profile) 1
...Job I/O Profiling
The I/O job profiling feature enables Accelerator to track and plot performance statistics over the time the job is running. A summary of this information is displayed after the job completes by use of the nc info –ioprofile JOBID command.
This feature can only be activated with a Mistral license, which must be installed at $VOVDIR/local/mistral.dat. Check with your system administrator for accessing and installing the license. You can get more information about the Mistral license at Altair License Management.
- Data Xferred – The total number of data transferred in the specified I/O direction.
- Throughput – A data rate calculated as a ratio of total data transferred divided by job run time.
- Effective BW - A data rate calculated as a ratio of total data transferred divided by total latency.
- I/O Ops – The number of I/O operations issued by the job for the specified I/O direction.
- Total Latency – The elapsed time for all I/O system calls, summed.
- Latency/Op - A ratio of total latency and number of I/O operations for the specified I/O direction
I/O Profiling Results - Read

Filesystem      Data Xfered     Throughput      Effective BW    I/O Ops         Total Latency   Latency/Op
/dev            1048576000B     349525333B/s    11351MB/s       1000            92372us         92us/op
/users/kfeind   0B              0B/s            N/A             0               0us             N/A

I/O Profiling Results - Write

Filesystem      Data Xfered     Throughput      Effective BW    I/O Ops         Total Latency   Latency/Op
/dev            0B              0B/s            N/A             0               0us             N/A
/users/kfeind   1048576000B     349525333B/s    500MB/s         1000            2094136us       2094us/op

Filesystems Accessed

Filesystem      Type            Source
/dev            devtmpfs        devtmpfs
/users/kfeind nfs sdc-storenado1:/export/user_home/kfeind % nc run –ioprofile ./myjob To view the summary profiling statistics, invoke the following CLI command after the job has completed.
% nc info –ioprofile JOBID% nc gui –ioprofile JOBID