Chart
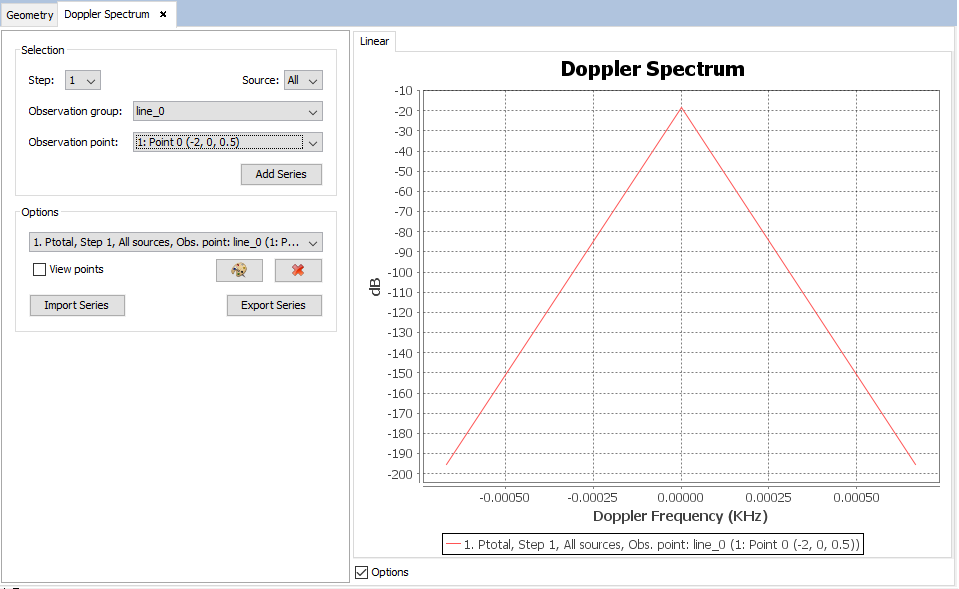
This command plots the Doppler frequency shift computed. Several cuts and frequencies can be plotted in the same graphic. To plot a graph, the user can select the source and observation point. A new graph will be plotted with the button ' Add Series'. In the case that the user has set up a parametrized geometry, it is possible to select the step to visualize the results for.
It is also possible to delete a series that is selected by the user from the list with the ' Remove Series '. The display option also allows changing the color of the series and display points. The buttons ' Import Series' and ' Export Series' are used for importing and exporting the selected series in 'List of Series' to a text file.
This panel displays a plot with the results and several options for adding and removing extra series from the plot.
When initially open, the panel will display a default series in the plot that will represent the measurements for a particular component, antenna, observation point and step. More series can be added, by selecting component and step in the control panel that appears on the left side of the plot.
- Step: the parametric step to select. These should have been defined prior to the calculation when designing the simulation.
- Antenna group The antenna to show the doppler spectrum results for. The user can select a specific antenna group or they can choose to show the results for all antennas.
- Observation group The observation points group that contains the point that the user wants to see the results for.
- Observation point The observation point to visualize the results for. This drop-down list shows the observation points included in the selected observation group.
