Example 2: Plot Trace
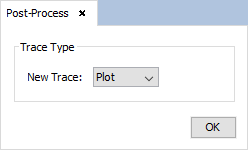
Step 1: Select “Plot” from the “Post-Process” window.
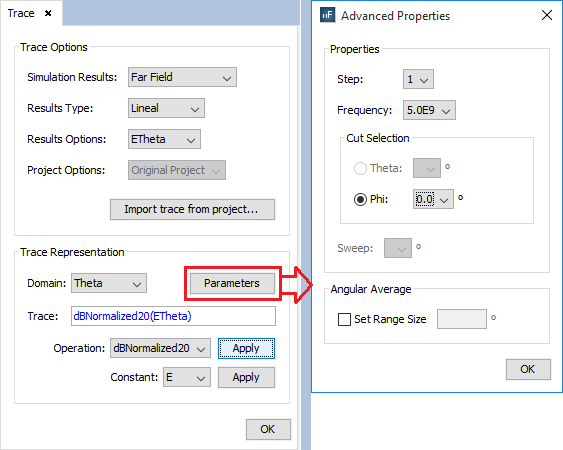
Step 2: Select the simulation results and the type and sub-type from it.
Step 3: Select the domain and apply the desired operations over the original results.
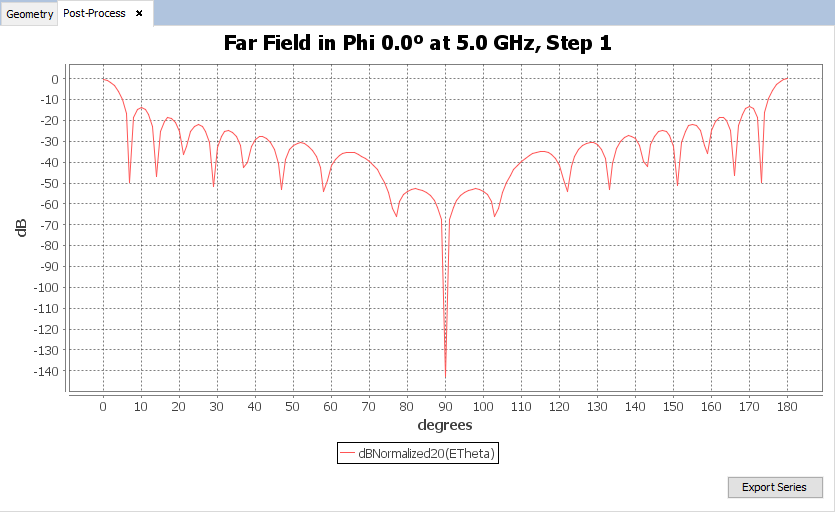
Step 4: Click on “OK” button and visualize the result.