
Curves
A curve in 3D modeling space is represented as a line geometry, referred to as a 3D curve.
Such curves are often used to define complex relationships that are difficult to express analytically, such as in a Point-to-Curve (PTCV) constraint.
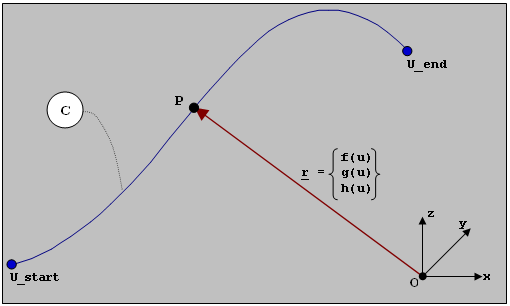
A curve is defined parametrically using a single free parameter, . As illustrated in the image below, consider a curve defined within a coordinate system . The coordinates of any arbitrary point on the curve, measured in , can be uniquely expressed as functions of :
These functions define the x-, y-, and z-coordinates of point P. The range of the parameter u, from its start to end values, determines the extent of the curve.
For information on how to add or edit an entity like a curve, see Entity Creation.
- Part: From the Features field, select
one or more geometric features on a part. Features can be edges and lines.Note: A curve can consist of multiple geometric features, but these features must be connected, form a continuous path, and belong to the same part.
- File:
- Spline Control: Select whether the points are to be exactly on the curve (Curve Points) or used to fit the curve (Control Points).
- Loop Type: Select whether or not the first and last point should be connected for a closed curve. Choosing Closed results in a continuous path for a constraint using this curve.
- Select .csv files for the X File, Y File, and Z File.
- Value:
- Spline Control: Select whether the points are to be exactly on the curve (Curve Points) or used to fit the curve (Control Points).
- Loop Type: Select whether or not the first and last point should be connected for a closed curve. Choosing Closed results in a continuous path for a constraint using this curve.
- Enter the x, y, and z data values for each point.
Double-click each cell in the table to edit the data values.
You can use the Add
and Delete
buttons to adjust the number of rows of data values in the table.
- Math:
- Spline Control: Select whether the points are to be exactly on the curve (Curve Points) or used to fit the curve (Control Points).
- Loop Type: Select whether or not the first and last point should be connected for a closed curve. Choosing Closed results in a continuous path for a constraint using this curve.
- Define the vector mathematically in the X
Expression, Y Expression, and
Z Expression fields.Below are two sample expressions:
Expression Description X Expression 0:10:1 X vector expression to generate a series of numbers from 0 to 10 at regular intervals of 1. Y Expression cos(Curve_0.x) Y vector expression to apply a cosine function on the X vector of the curve. Z Expression sin(Curve_0.x) Z vector expression to apply a sine function on the X vector of the curve.
Curve Properties
Descriptions of curve properties in the Property Editor.
| Property Name | Description | |||
|---|---|---|---|---|
| General | ||||
| Name | Name of the entity | |||
| Variable Name | The variable name, a unique identifier string of the entity | |||
| ID | A unique identifying integer | |||
| Type | 3D Cartesian | |||
| Properties | ||||
| X | Data source | File This is set in the guide panel. |
||
| File | Browse for location of .csv file with data values. | |||
| Type | The Type is a block of data. Options are Unknown, column_names, and Index where column_names refer to the name assigned to the column in the header row of the .csv file for each column. If the .csv does not have any header row, column_names take default names as Column 1, Column 2 etc. | |||
| Request | The Request is a sub-block of data. Options available depend on
the value of Type. If Type is set to Unknown, Request is set to Block 1. If Type is set to Column 1 or Index, Request is set to Index. |
|||
| Component | The component is a vector (or column) within a sub-block of data.
Options available depend on the value of Type. If Type is set to Unknown, options are column_names. If Type is set to Column 1, Component is set to Column 1. If Type is set to Index, Component is set to Index. |
|||
| Data source | Value This is set in the guide panel. |
|||
| Values | Click to open the guide panel and set values. | |||
| Data source | Math This is set in the guide panel. |
|||
| Math | Enter an expression for the X vector. | |||
| Y | Data source | File This is set in the guide panel. |
||
| File | Browse for location of .csv file with data values. | |||
| Type | The Type is a block of data. Options are Unknown, column_names, and Index where column_names refer to the name assigned to the column in the header row of the .csv file for each column. If the .csv does not have any header row, column_names take default names as Column 1, Column 2, etc. | |||
| Request | The Request is a sub-block of data. Options available depend on
the value of Type. If Type is set to Unknown, Request is set to Block 1. If Type is set to Column 1 or Index, Request is set to Index. |
|||
| Component | The component is a vector (or column) within a sub-block of data.
Options available depend on the value of Type. If Type is set to Unknown, options are column_names. If Type is set to Column 1, Component is set to Column 1. If Type is set to Index, Component is set to Index. |
|||
| Data source | Value This is set in the guide panel. |
|||
| Values | Click to open the guide panel and set values. | |||
| Data source | Math This is set in the guide panel. |
|||
| Math | Enter an expression for the Y vector. | |||
| Z | Data source | File This is set in the guide panel. |
||
| File | Browse for location of .csv file with data values. | |||
| Type | The Type is a block of data. Options are Unknown, column_names, and Index where column_names refer to the name assigned to the column in the header row of the .csv file for each column. If the .csv does not have any header row, column_names take default names as Column 1, Column 2, etc. | |||
| Request | The Request is a sub-block of data. Options available depend on
the value of Type. If Type is set to Unknown, Request is set to Block 1. If Type is set to Column 1 or Index, Request is set to Index. |
|||
| Component | The component is a vector (or column) within a sub-block of data.
Options available depend on the value of Type. If Type is set to Unknown, options are column_names. If Type is set to Column 1, Component is set to Column 1. If Type is set to Index, Component is set to Index. |
|||
| Data source | Value This is set in the guide panel. |
|||
| Values | Click to open the guide panel and set values. | |||
| Data source | Math This is set in the guide panel. |
|||
| Math | Enter an expression for the Z vector. | |||
| Attributes | ||||
| X | Scale |
Define the scale for the X vector. When a data vector is scaled, the vector is multiplied by a specified value. The original data values are not actually altered. |
||
| Offset | Define the offset for the X vector. Offsetting a data vector shifts the data along the corresponding axis. | |||
| Y | Scale |
Define the scale for the Y vector. When a data vector is scaled, the vector is multiplied by a specified value. The original data values are not actually altered. |
||
| Offset | Define the offset for the Y vector. Offsetting a data vector shifts the data along the corresponding axis. | |||
| Z | Scale |
Define the scale for the Z vector. When a data vector is scaled, the vector is multiplied by a specified value. The original data values are not actually altered. |
||
| Offset | Define the offset for the Z vector. Offsetting a data vector shifts the data along the corresponding axis. | |||
| Signal | ||||
| User-defined | Use a subroutine to define the curve.
|
|||