Optimisation
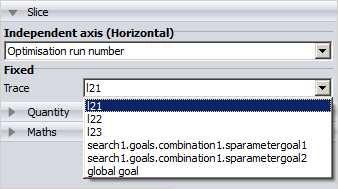
Optimisation data such as optimised parameters, goals, global goals and masks can be viewed on a Cartesian graph after OPTFEKO was used to calculate the results.
On the Home tab, in the
Add results group, click the ![]() Optimisation icon.
Optimisation icon.