Review Section Properties of 1D Elements
Use the Review tool to plot area moments of inertia and stiffness.
This tool allows you to plot area moments of inertia as well as stiffness terms (Elyy, Elzz, and GJ) either as a contour or a vector plot. In addition, a legend provides extra quantities such as Elemental axis (X,Y,Z), the orientation vector (V), Neutral axis position, Shear center position, and released degrees of freedom at both ends.
-
From the 1D ribbon, Edit Beam tool group, click the
Review tool.

Figure 1. -
Use the second drop-down to select the plot type.
The selected element must have a beamsection entity assigned to its property in order to extract data names to contour or vector plot. If a material is assigned with young modulus or shear modulus available, stiffness terms are calculated. Shear modulus is not recalculated from Poisson's ratio.
Contour and vector plots enable you to see stiffness drop along a path. Vector plots capture all beamsections assigned to a PBEAM/PBEAML and can plot every intermediate station.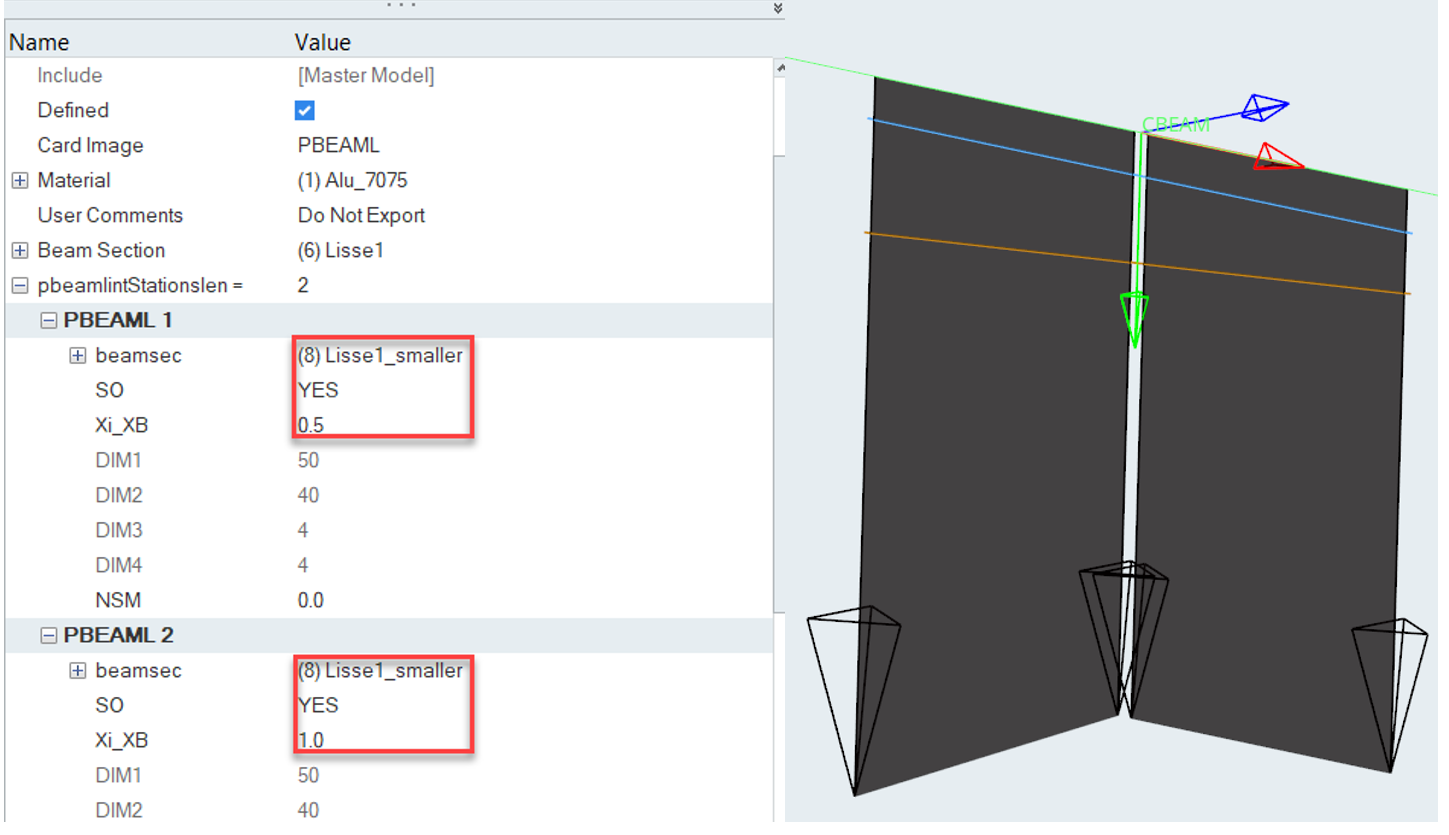
Figure 2.In the image above, the neutral axis line shows discontinuities in neutral axis position. This could be due to element formulation changes (CBAR vs. CBEAM) or inconsistent offset values. The shear center line displays the shear center position after offset. This is useful when you don't know the actual section shape.
If the Review offset checkbox is enabled, you can hover over an element to review its current offset values and whether it's in a displacement system or elemental system.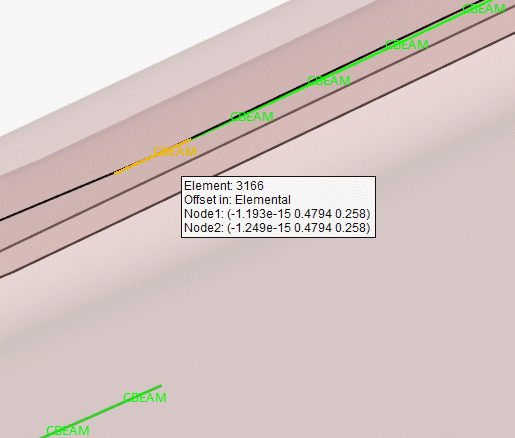
Figure 3.