ERRI
Computing Margin of Safety with ERRI B12 RP60.
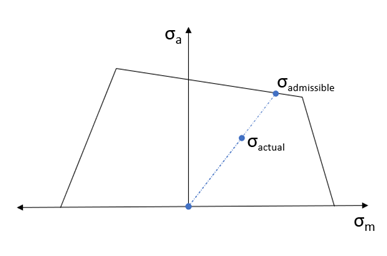
Figure 1.
= Stress Amplitude
= Mean Stress
HyperLife calculates Margin of Safety using Haigh Diagram or SN curve.
With single or multiple Haigh Diagrams, mean stress correction should be set to INTERPOLATE. If single SN curve, margin of safety is evaluated based on the mean stress model selected. (Similar to Safety Factor evaluated in Stress Life uniaxial: Uniaxial Fatigue Analysis)
Welded evaluation for margin of safety supports identification of worst subcase pair using Range Envelope Configuration. Range Envelope is based on maximum principal range among all the subcases assigned in the fatigue event.
| Evaluation Distance |
Reference distance to find the evaluation location from the weld element at which the stress values are extracted. Read more: Find Evaluation Positions |
| Weld Width | Width of the weld material from the web wall. This parameter is ignored if specifying the evaluation distance is done manually. |
| Scale | Scale is used to modify the calculated stress during the stress history generation. |
| Offset | Offset is used to modify the calculated stress during the stress history generation. |
| Kf | Fatigue strength reduction factor. Default = 1.0 Read more: Other Factors Affecting Fatigue (Fatigue Strength Reduction Factor) |
| Weld Detail Category - Transverse Location_X | Haigh Diagram/ SN curve considered for the calculation of Margin of Safety and fatigue of the normal stress component in the transverse direction (perpendicular to the axis of the weld) at ‘X’. |
| Weld Detail Category - Longitudinal Location_X | Haigh Diagram/ SN curve considered for the calculation of Margin of Safety and fatigue of the normal stress component in the longitudinal direction (parallel to the axis of the weld) at ‘X’. |
| Weld Detail Category - Shear Location_X | Haigh Diagram/ SN curve considered for the calculation of Margin of Safety and fatigue of the shear stress component at ‘X’. |