View the Status of a Cluster at a Glance
See the general status of HPC topics/nodes to understand what your HPC system is doing.
View the Status of a Cluster's Nodes
View a graphical representation of the status of a cluster's nodes.
-
Click the Nodes tab from the PBS Professional menu located on the left-hand side of the web
page.
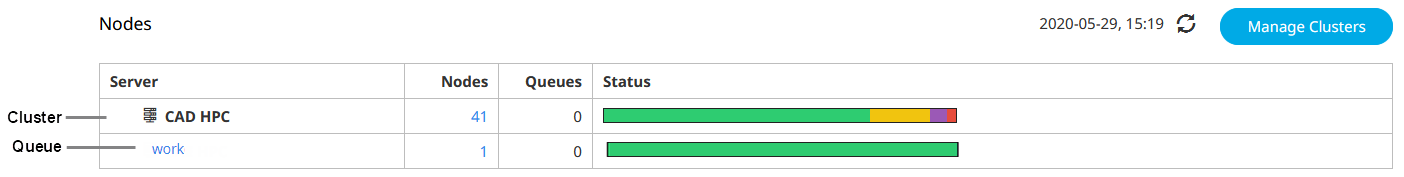
A summary of all HPC clusters are displayed. Each cluster is represented by a row containing the cluster name, the total number of nodes, the number of queues within the cluster, and a colored bar graphically depicting the status of the nodes.Tip: By default, the latest job and node data is automatically retrieved and displayed every 5 minutes. Refresh the data manually by clicking
 .
.

Figure 1. Refresh Data
Understand the Node View
A high-level view of the status of an HPC cluster's nodes.
A key step in monitoring and maintaining cluster health is to identify any deviance from normal operational state or performance. The Node View provides a view to the status of a cluster or a queue at a glance so that you can identify problem nodes, and drill down to node details for further investigation. A colored bar graphically displays the condition of the cluster or queue.
Each cluster is represented by a row containing the cluster name, the number of nodes and queues within the cluster, and a colored bar graphically depicting the condition of the cluster's nodes. The length of a color indicates the ratio of nodes in each condition.
| Color | Condition | State |
|---|---|---|
| Red | requires attention | down, stale, state-unknown, unresolvable |
| Green | in use | job-busy, job-excl, resv-exclusive |
| Purple | unavailable | offline, provisioning, wait-provisioning |
| Yellow | available | free |
| Orange | idle | idle |
You can drill-down to get detailed node information about all the nodes in a cluster, nodes attached to queue, or a subset of nodes in either of these categories filtered by condition.