Working with the Context Menu
The visualizations in a workbook provide the following right-click menu options:
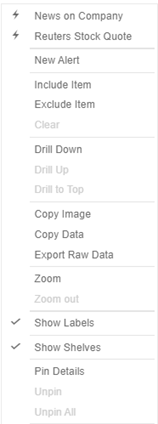
Visualization Context Menu
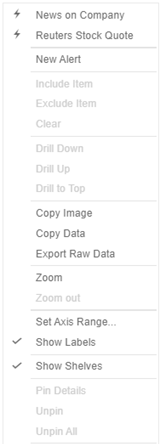
Visualization Context Menu of the Numeric Axis
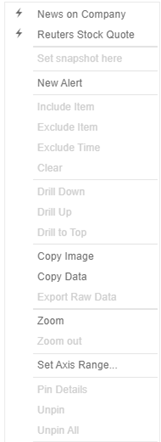
Time Series Visualization Context Menu of the Time Axis
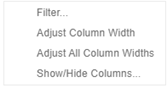
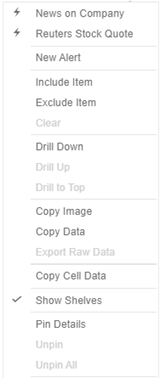
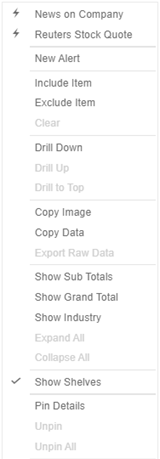
Table visualization context menus depending on where you click on the visualization
| Context Menu | Description |
|
Filter |
Allows filtering of a data table column.
|
|
Run an automatic parameterization. |
|
|
Run a workbook action on the visualization. |
|
|
New Alert |
Create an alert. |
|
Allows visualization filtering. Options include:
|
|
|
Allows drilling into visualizations. Options include:
|
|
|
Allows exporting of data. Options include:
|
|
|
Allows zooming in and out of visualization sections. |
|
|
Show Labels |
Determines whether labels are displayed or not. |
|
Available when Enable Shelves is enabled in the visualization’s General settings. Either check Show Shelves in the context menu or tap the Shelves slider in the General settings to display cross tab, breakdown, and variable shelves in the visualization. |
|
|
Allows pinning of the Details pop-up. Options include:
|
The additional time series visualization context menu options include:
| Setting | Description |
|
Available in the time series visualization context menu when the Snapshot Grid Line is rendered or set to Dotted, Dashed, or Solid in the Time Axis variable. |
|
|
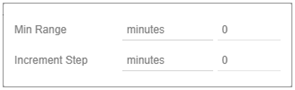
Set Axis Range |
Allows setting of the time axis range:
The minimum time axis range. Supported units are milliseconds, seconds, minutes, hours, days, months, quarters, and years.
Controls how much the time axis span is extended at the point when the latest value is at the end of the current time axis span. Supported units are milliseconds, seconds, minutes, hours, days, months, quarters, and years.
|
The additional Table visualization context menu options include:
| Setting | Description |
|
Adjust column width in the table visualization. |
|
|
Hide or display columns in the table visualization. |
|
|
Display the hierarchy column. |
|
|
Expand or collapse sections of the hierarchy. |
|
|
Show Grand Total |
Determines whether the Grand Total aggregate row is shown in the table. |
|
Show Sub Totals |
Determines whether Sub Total aggregate rows are shown in the table. |
|
Show <Column> |
Display the breakdown column. |
(c) 2013-2025 Altair Engineering Inc. All Rights Reserved.