Visualization Filtering
Visualizations themselves can be used as filters by selecting items, and right-clicking to display the context menu with these three options:
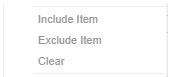
- Include Item filters the dashboard to include the selected items.
- Exclude Item filters the dashboard to exclude the selected items.
- Clear removes any visualization filters.
For time series visualizations, an additional option is available.
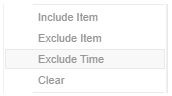
Exclude Time filters all the series to exclude the time point/s.
When a visualization filter is applied, filter icons appear at the left of the filter column title ![]() and on the
and on the ![]() toolbar of the dashboard. Clicking
toolbar of the dashboard. Clicking ![]() or
or ![]() will remove the filter.
will remove the filter.
Also, the Show Active Filters  icon displays on the toolbar. This allows viewing of all the active filters on the dashboard and its visualizations.
(c) 2013-2025 Altair Engineering Inc. All Rights Reserved.