Timeseries Surface Plot Settings (Legacy)
Time Series Surface Plots are used to identify trends and outliers within Time Series surfaces, typically forward curves across time.
The Surface is made up of a series of points where each point has:
Time Position
Y Position
Color (which represents the Z axis).
The color scale can be continuous or stepped to show a surface gradient.
The timeseries surface plot settings pane is displayed after clicking the Options ![]() button.
button.

| Setting | Description |
| Show Points | Determines whether surface data points are shown. |
| Rectilinear Grid | Determines whether distinct y values and time slices are changed into a rectilinear grid where missing values are filled in with a default of zero (or the ground level). |
| Show Coordinates | Determines whether the graph coordinates (i.e., X-Y plots, or Date/Time-Y plots) on mouse over are displayed in the visualization. |
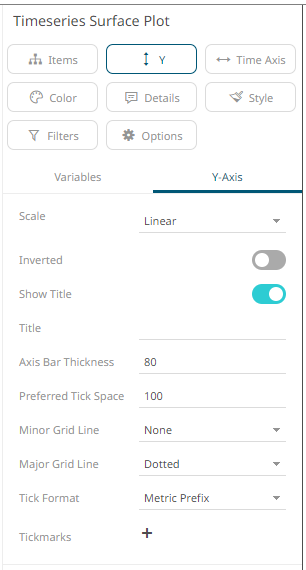
Other visualization-specific properties can be set by clicking on the Y-Axis variable drop area and then selecting the Y-Axis tab:

(c) 2013-2025 Altair Engineering Inc. All Rights Reserved.