Visualizations Axes
| Setting | Description |
|
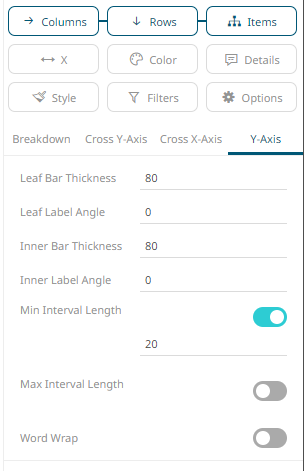
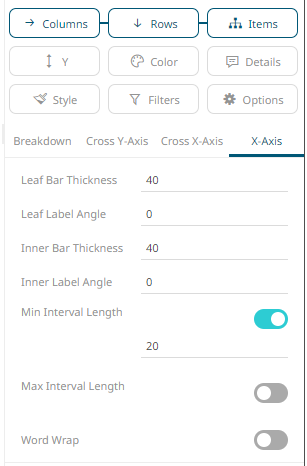
Leaf Bar Thickness |
The thickness of the leaf or lowest level of data. The default value is 80. |
|
Leaf Label Angle |
The Label angle of the leaf or lowest level of data of the crosstab axis. Default is 0, accepts values between -90 and +90. |
|
Inner Bar Thickness |
The width or height allocated for the non-leaf components of the crosstab axis in pixels. Default is 80. |
|
Inner Label Angle |
The angle of the non-leaf labels. Default is 0, accepts values between -90 and +90. |
|
Min Interval Length |
The minimal interval in pixels between cross tabbed visualizations. Default is 100. |
|
Max Interval Length |
The maximum interval in pixels between cross tabbed visualizations. Default is 400. |
|
Word Wrap |
Determines whether to wrap the crosstab axis text. |
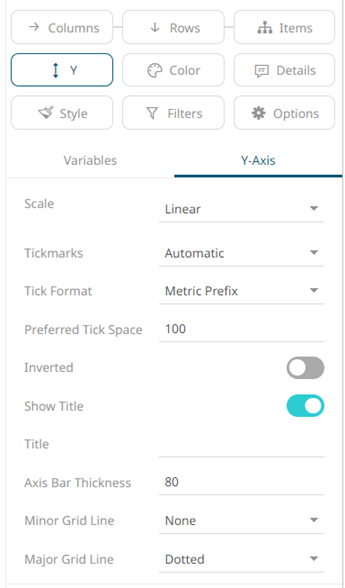
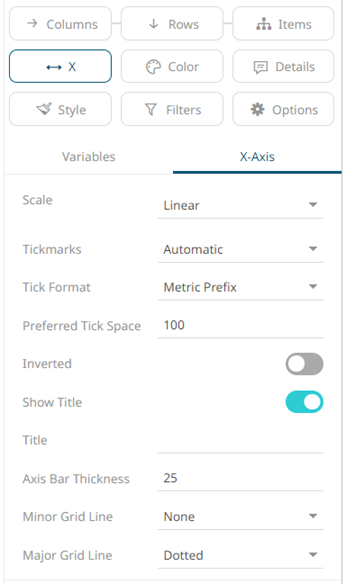
Some visualizations may also include the following X and Y axes settings:
| Setting | Description |
|
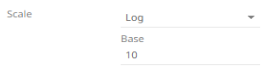
Scale |
Determines whether the scale of the axis is Linear, Log, or Power.
|
|
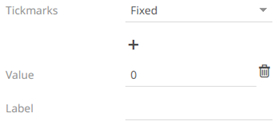
Tickmarks |
Determines whether the tick marks are set to Automatic, Fixed, or None.
|
|
Tick Format |
Set to From Variable to use the format string that is on the current variable displayed in the axis. Set to Metric Prefix to format the Tick labels in the numeric axes using the metric prefixes. |
|
Preferred Tick Space |
The preferred space in pixels between the minor grid lines across the axis. |
|
Inverted |
Determines whether the Y or Height axis (for Vertical) or X or Width axis (for Horizontal) is inverted. |
|
Show Title |
Displays an Axis Title label. When enabled, you can opt to enter a custom Title for the axis which will override the title of the visualization variable. |
|
Axis Bar Thickness |
The margin in pixels for the axis. If set to zero, the axis is removed. |
|
Preferred Tick Space |
The preferred space in pixels between the minor grid lines across the axis. |
|
Minor Grid Line |
How minor grid lines are drawn across the axis. Allowed values:
|
|
Major Grid Line |
How major grid lines are drawn across the axis. Allowed values:
|
 .
.
 to delete.
(c) 2013-2025 Altair Engineering Inc. All Rights Reserved.