Spread Graph Settings (Legacy)
The Spread Graph displays the variance or spread between two time-based data series.
Typical use cases include comparing a stock’s price performance to an Index or a bond’s yield to a benchmark rate.
The spread graph settings pane is displayed after clicking the Options  button.
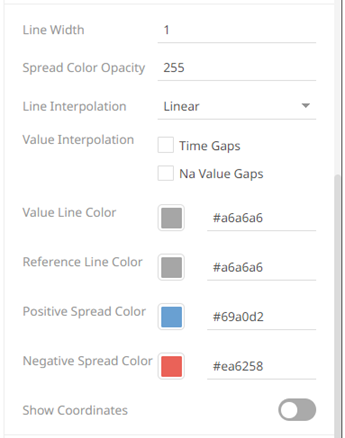
| Setting | Description |
| Line Width | Specifies the width in pixels of the Spread Graph data series lines. |
| Spread Color Opacity | Specifies the level of color transparency/opacity for the Positive and Negative Spread colors. The value is from 0 to 255 with the default set to 128. |
| Line Interpolation | Specifies the interpolation mode as Linear, Stepped, or Smooth. |
| Value Interpolation Time Gaps | Determines whether to interpolate across weekend and closed period gaps. |
| Value Interpolation Na Value Gaps | Determines whether Na value (or missing) gaps are interpolated. |
| Value Line Color | Specifies the color of the value line data series. |
| Reference Line Color | Specifies the color of the reference line data series. |
| Positive Spread Color | Specifies the color when the spread between the value and reference is positive. |
| Negative Spread Color | Specifies the color when the spread between the value and reference is negative. |
| Show Coordinates | Determines whether the graph coordinates (i.e., X-Y plots, or Date/Time-Y plots) on mouse over are displayed in the visualization. |
Other visualization-specific properties can be set by clicking on the Y-Axis variable drop area and then selecting the Y-Axis tab:
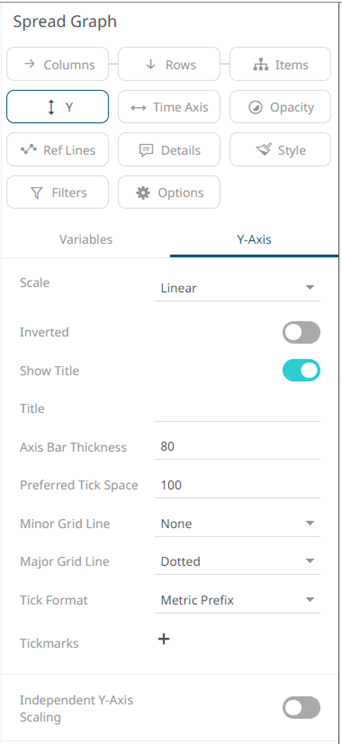
| Setting | Description |
| Independent Y-Axis Scaling | Determines whether to have each visualization Y-axis in a cross tab automatically scaled independent of the others. |
(c) 2013-2025 Altair Engineering Inc. All Rights Reserved.