Numeric Stacked Needles Graph Settings (Legacy)
Numeric Stacked Needles again display price distributions.
Unlike the standard Numeric Needle Graph, multiple items can be identified at a single price.
A common usage is displaying client activity within an order book.
The numeric stacked needle graph settings pane is displayed after clicking the Options  button.
| Setting | Description |
|
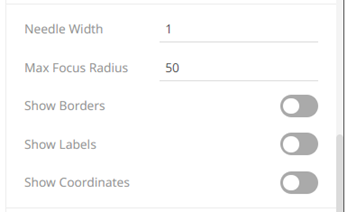
Needle Width |
Specifies the width in pixels of each needle: NOTE: This is overridden when a column is added in the Size variable. Consequently, |
|
Max Focus Radius |
Determines the maximum radius of the focus circle when hovering on the needles. This also controls the padding of the axis in the direction in which the needles expand, |
|
Show Borders |
Specifies whether a border is drawn around needles. These are only visible if the |
|
Show Labels |
Specifies whether node labels will be displayed. |
|
Show Coordinates |
Determines whether the graph coordinates (i.e., X-Y plots, or Date/Time-Y plots) |
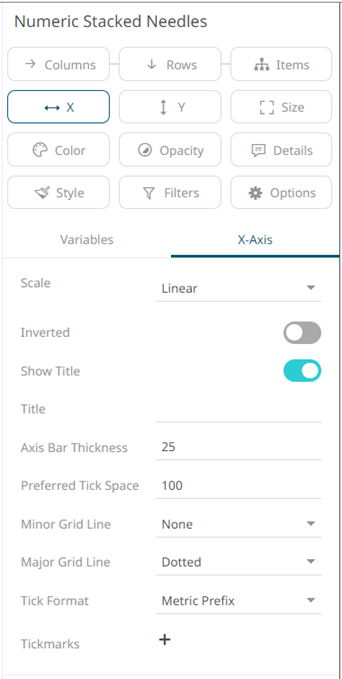
Other visualization-specific properties can be set by clicking on the X-Axis variable drop area and then selecting the X-Axis tab:
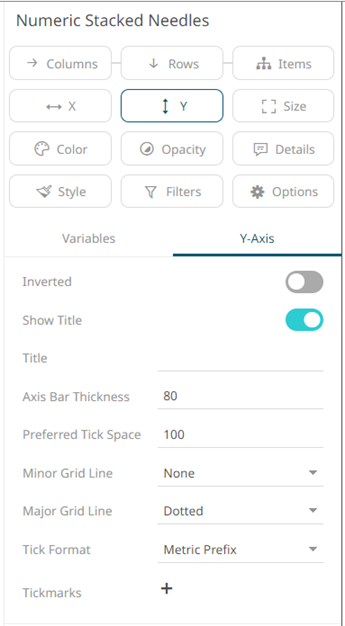
Or also, by clicking on the Y-Axis variable drop area and then selecting the Y-Axis tab:
(c) 2013-2025 Altair Engineering Inc. All Rights Reserved.