Adding a Shape Legend
Shape Legend displays the shape variables of the associated visualization (Scatter vPlot, Table, Time Combination, and Time series Scatter Plot). You can also set the orientation or enable the ability to do a filter or to display this part in the PDF
output.
- After double-clicking or drawing a rectangle on the dashboard canvas, scroll to the Legends section of the Part Types pane and select Shape Legend
 .
.
The Shape Legend Settings pane is displayed, and the Shape Legend part is added on the dashboard canvas.
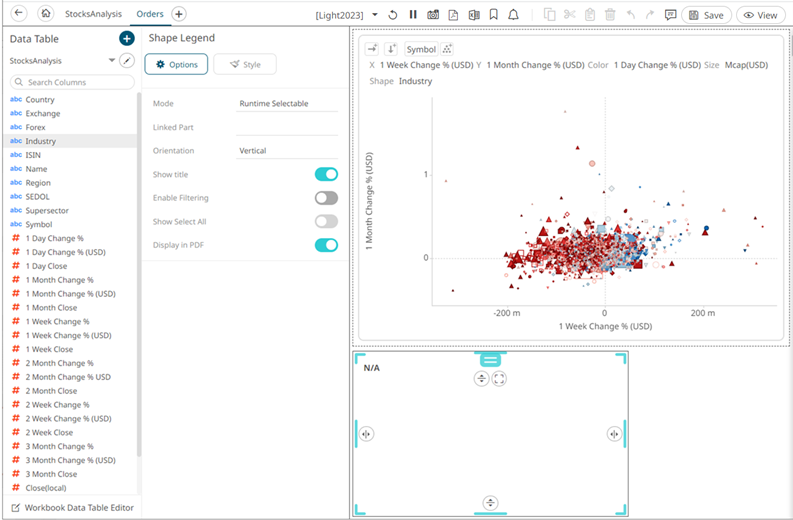
- Select the legend's Mode:
- Runtime Selectable
This mode is applicable when connecting to combination graphs, axis graphs, and table visualizations.
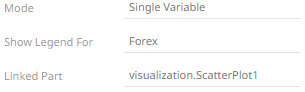
- Single Variable
Sets the shape legend to a specific source column of a parent visualization.
- Runtime Selectable
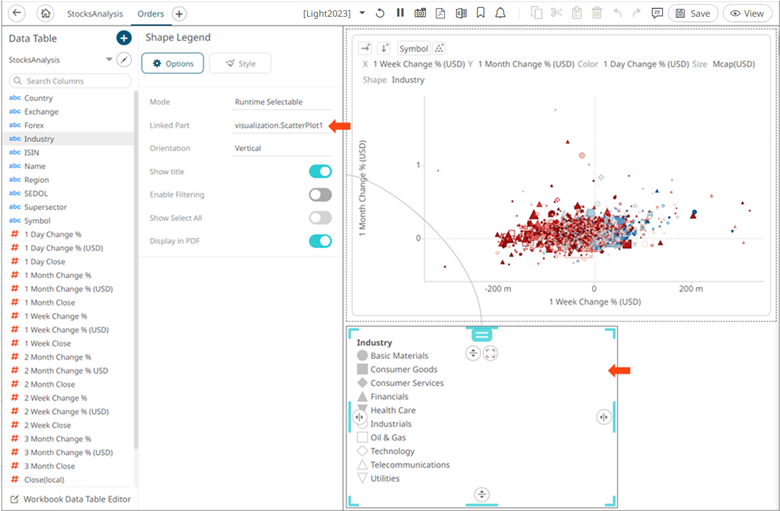
- Select any of the available parent visualizations with shape variables from the Linked Part drop-down list.
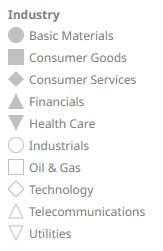
The shape legend is connected to its parent visualization and the link between them is displayed. The shape variables are retrieved from this visualization and displayed in the legend.
For the Single Variable mode, the Show Legend For field is automatically filled with the column of the shape variable in the parent visualization.
For the Runtime Selectable mode, this automatically maps all of the shapes of the time combination graph to the legend.
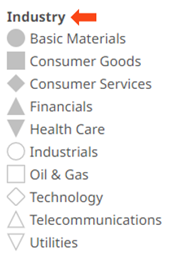
- For test shape legends, you can display them either:
- Vertical
- Horizontal
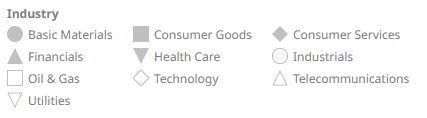
- Vertical
- Tap the Show Title slider to turn it on and display the variable name.

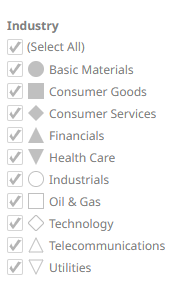
- Enable filtering and allow selection of all items (Show Select All):

- Tap the Display in PDF slider to turn it on and include this dashboard part in the PDF output.
- To set the style of the Shape Legend, click Style
 .
.
The page updates to display the Style pane.
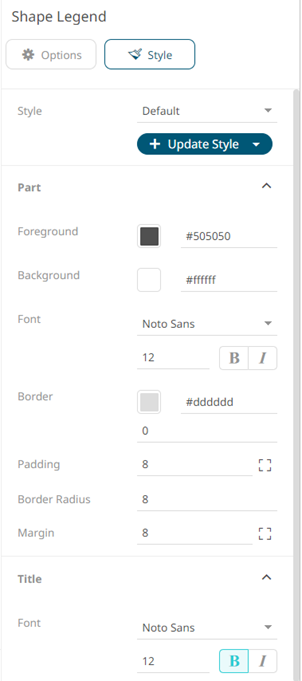
See Defining the Style of General Parts for more information.
- Click Update Style
 and select any of the following options:
- Set current as default – Save the changes and set it as the default.
- Create custom style – Save the changes and set it as a custom style.
The Style pane updates to display the Title control.
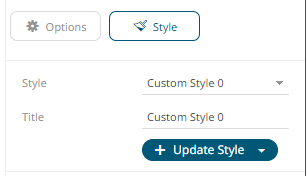
- Enter the custom style's Title.
- If there are additional changes made, click Update Current Style in the Update Style drop-down.
The new custom style is added to the Workbook > Theme > Custom Styles list.
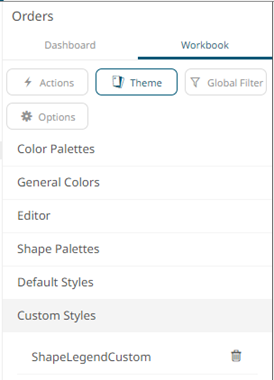
If published, the custom style configuration of the Shape Legend will be added to the Global custom styles list and can be applied to other parts.
- Reset to default – Revert to the original default settings.
- Click the Save
 icon on the toolbar to save the changes.
(c) 2013-2025 Altair Engineering Inc. All Rights Reserved.