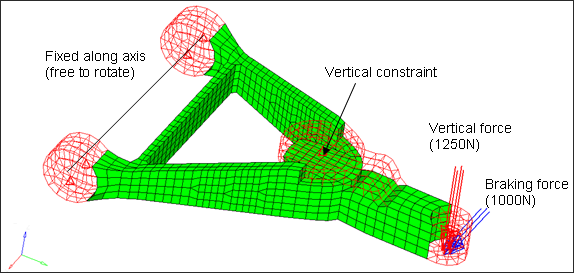
In this tutorial, a control arm loaded by brake force and vertical force is used, as
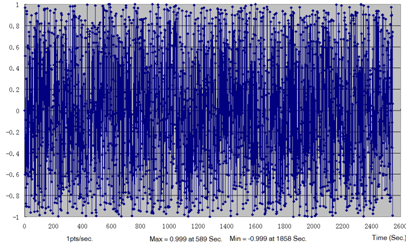
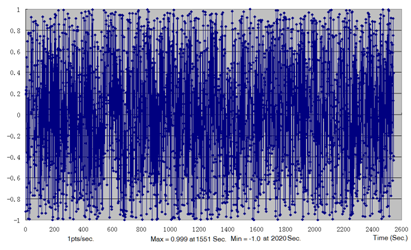
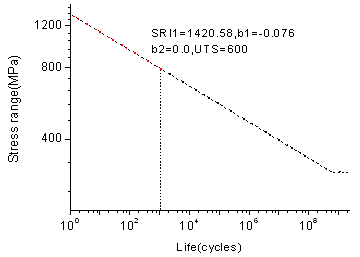
shown in Figure 1. Two load time histories acquired for 2545 seconds with 1 HZ, shown in Figure 2, are adopted. The SN curve of the material used in the control arm is shown in
Figure 4. Because a crack always initiates from the surface, a skin meshed with shell
elements is designed to cover the solid elements, which can improve the accuracy of
calculation as well.Figure 1. Model of the Control Arm for Fatigue Analysis Figure 2. Load Time History for Vertical Force Figure 3. Load Time History for Braking Force Figure 4. SN Curve
The model being used for this exercise is that of a control arm, as shown in Figure 1. Loads and boundary conditions and two static loadcases have already been defined
on this model.