Ribbon: Post
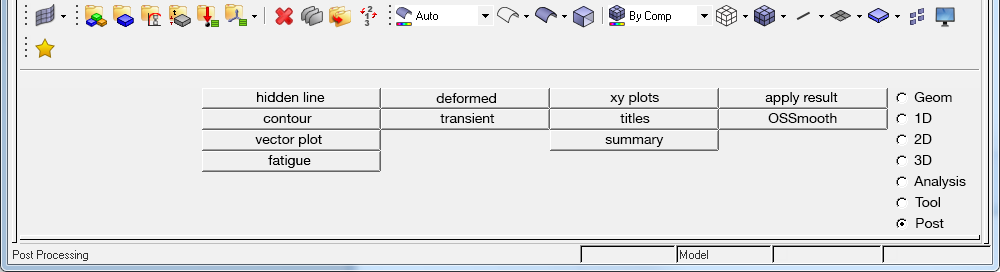
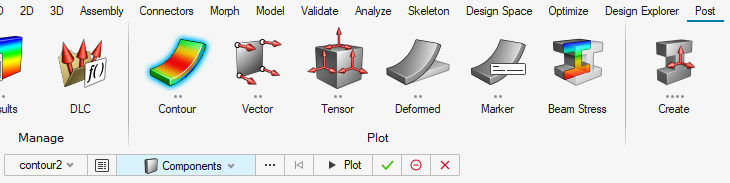
Tool: Contour
Use the Contour tool to visualize result data by coloring entities by value, allowing for easy identification of maximums and minimums throughout the model.
Visit help
- Create

- Edit
- Assign
- Delete
- Card Edit
- Organize
- Renumber
- Check
- Translate
- Rotate
- Scale
- Reflect
- Project
- Position
- Permute
- Metadata to CAE
- Autocleanup
- Geom Match Topology
- CAD Update
- Quick EditF11
- Defeature
- Nodes
- Free Points
- Fixed Points
- Lines
- Surfaces
- Midsurfaces
- Solids
- Vectors
- Systems
 XYZ
XYZ On Geometry
 Arc Center
 Extract Parametric
 Extract on Line
 Interpolate Nodes
 Interpolate on Line
 Interpolate on Surface
 Intersect
- Temp Nodes
 XYZ
XYZ Arc Center
 Extract Parametric
 Intersect
 XYZ
XYZ Linear Nodes
 Standard Nodes
 Smooth Nodes
 Controlled Nodes
 Drag along Vector
 Arc Center and Radius
 Arc Nodes and Vector
 Arc Three Nodes
 Circle Center and Radius
 Circle Nodes and Vector
 Circle Three Nodes
 Conic
Conic Extract Edge
 Extract Parametric
 Intersect
 Manifold
 Offset
 Midline
 Fillet
 Tangent
 Normal to Geometry
 Normal from Geometry
 Normal 2D on Plane
 Features
 Square
 Cylinder Full
 Cylinder Partial
 Cone Full
 Cone Partial
 Sphere Center and Radius
 Sphere Four Nodes
 Sphere Partial
 Torus Center and Radius
 Torus Three Nodes
 Torus Partial
 Spin
Spin Drag along Vector
 Drag along Line
 Drag along Normal
 Drag along Normal from Surfaces
 Spline/Filler
 Ruled
Ruled Skin
Skin Fillet
 From FE
 Meshline
- Ribs
- Spline from Bound Nodes
 Block
Block Cylinder Full
 Cylinder Partial
 Cone Full
 Cone Partial
 Sphere Center and Radius
 Sphere Four Nodes
 Torus Center and Radius
 Torus Three Nodes
 Torus Partial
 Bounding Surfaces
 Spin
Spin Drag along Vector
 Drag along Line
 Drag along Normal
 Ruled Linear
 Ruled Smooth
- Ribs
- Nodes
- Fixed Points
- Lines
- Surface Edges
- Surfaces
- Midsurfaces
- Solids
- Vectors
- Nodes
- Free Points
- Lines
- Surfaces
- Solids
- Vectors
- Systems
- Nodes
- Free Points
- Fixed Points
- Lines
- Surfaces
- Solids
- Vectors
- Systems
- Create
- Edit
- Assign
- Delete
- Card Edit
- Organize
- Renumber
- Check
- Translate
- Rotate
- Scale
- Reflect
- Project
- Position
- Permute
- Mesh Controls
- Quick EditF11
- Cleanup Elements
- Boolean Operation
- Fuse
- Hole/Gap Fill
- Facets from Nodes
- Line Mesh
- 2D AutoMeshF12
- MidSurf Mesh
- Midmesh
- Tetra Mesh
- Solid Map Mesh
- Voxel Mesh
- Shrink Wrap Mesh
- EM Lattice Mesh
- Adaptive Wrap Mesh
- Acoustic Cavity Mesh
- Coarsen Mesh
- Tetramesh Process
- NodesF8
- Masses
- 1D Elements
- 2D Elements
- 3D Elements
- NodesShift + F8
- Replace NodesF3
- Masses
- Elements
- 1D Elements
- Nodes
- Elements
- Nodes
- Elements
- Components
- Normals
- Material Directions
- Comparison
- Connectivity
- Duplicates
- Check ElementsF10
- Quality Index
- Quality Report
- Solid Mesh Optimization
- Create
- Edit
- Assign
- Delete
- Card Edit
- Organize
- Renumber
- Check
- Realize
- Unrealize
- Translate
- Rotate
- Scale
- Reflect
- FE Absorb
- Spots
- Bolts
- Seams
- Areas
- Masses
- Connectors
- Autopitch
- Nodes
- Elements
- Connectors
- Create
- Organize
- Renumber
- Section Cut
- HyperBeam
- HyperLaminate
- Create
- Edit
- Assign
- Delete
- Card Edit
- Organize
- Renumber
- Check
- Loads on Geometry
- Contour Loads
- Loads
- Groups
- Create
- Edit
- Delete
- Card Edit
- Organize
- Renumber
- Create
- Edit
- Delete
- Card Edit
- Organize
- Renumber
- Convert
- Translate
- Rotate
- Scale
- Reflect
- Position
- Contact Browser
- Set Browser
- Count
- References
- Unused
- Empty
- Summary Template
- Mass Details
- ID Manager
- Model Checker
- Mass Trimming
- Matrix Browser
- Orientation Review
- Transformation Tool
- Find and Replace
- Fatigue Process
- Freq Resp Process
- Pretension Manager
- Thermal Setup
- Weld line detection
- Component Table
- Material Table
- Property Table
- Load Collector Table
- Load Step Browser
- Contact Comparison
- PLOTEL from DMIG
- Create Cards
- DDAM
- OptiStruct
- Deformed
- Contour
- Vector Plot
- Free Body
- Transient
- HyperView
- Free Body Results Manager
- Free Body Export Manager
- Create
- Edit
- Assign
- Delete
- Card Edit
- Organize
- Renumber
- Curve Editor
- Plots
- Curves