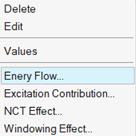
Within the plot section, right-click to display additional options for Critical Path,
Energy Flow, Excitation Contribution, NCT Effect, and Windowing Effect as a bar
chart for a specific frequency.Figure 1.
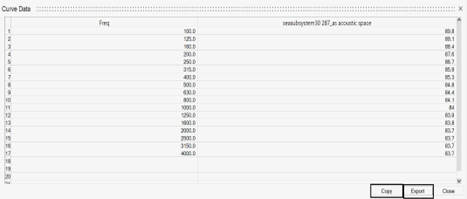
From the NVH Plot Manager Browser, click the table icon in the lower right corner to
display a table view. Use this to see a spreadsheet view of the SEAM results. This view displays the numerical values of the
calculated quantities. From the plot, right-click and select Export
Curves to export the results into a CSV format as shown below. Use
Copy to copy the curves to the clipboard.Figure 2. NVH Plot Manager Table
After generating plots, copy the results in one of the following ways.
After generating the curve data, there are options to copy and export data.
Click Copy to copy and paste all curve data into an
Excel spreadsheet.
Click Export to export the curve data into a new
file.
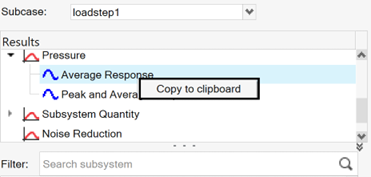
If required, copy only the cells you need.
Right-click on the result and use the Copy to
clipboard option to copy all curve data simultaneously.