Efficiency map
Positioning and objective
The aim of the test “Performance mapping – Sine wave – Generator – Efficiency map” is to characterize the behavior of the machine in the "Torque-Speed" area.
This test gives an overview of the electromagnetic behavior of the generator as a function of its speed.
Electrical power, mechanical torque, output voltage, electrical current, power balance, power factor and control angle are plotted versus speed.
Input parameters define the zone in which the evaluation of the machine behavior is performed.
Input parameters like the “maximum Line-Line voltage”, the “maximum line current” and the targeted “Maximum speed” of the machine are considered.
One type of command mode is available: The Maximum Torque Per Amps command mode (MTPA).
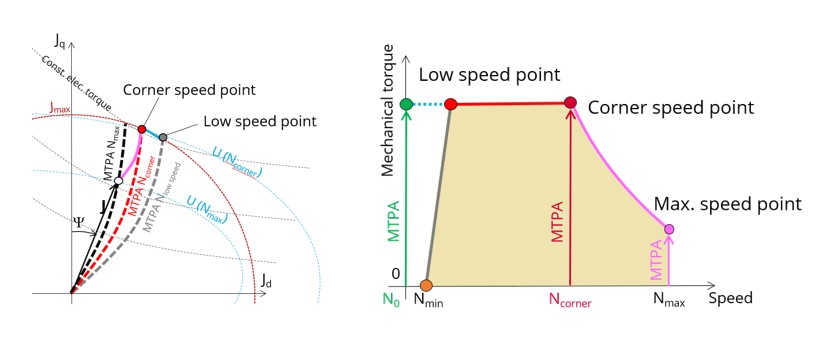
In the results, the performance of the machine at the corner speed point and for the maximum speed set by the user are presented.
The iso-electromagnetic torque, the iso-current and the iso-voltage are also displayed in Jd-Jq plane.
These results help the user to understand the possible performance of the machine in its electric environment.
Moreover, two additional features are available in this test.
The first one allows extracting one point from the efficiency map to get the machine performance, for this specific working point (general data + power balance).
The second feature allows the user to define a duty cycle by giving a list of working points (speed, torque) versus the time. The displayed results illustrate the machine performance over the considered duty cycle (mean, min, and max values).
The time variation of the main quantities is also displayed (Mechanical torque, speed, control angle, current, voltage, power, efficiency, losses).
All the corresponding points are displayed on the provided maps.
The following table helps to classify the test “Performance mapping – Sine wave – Generator – Efficiency map”.
| Family | Performance mapping |
|---|---|
| Package | Sine wave |
| Convention | Generator |
| Test | Efficiency map |
Inputs
For more details, please refer to Inputs.
Thermal
For more details, please refer to Thermal.
Mechanics
For more details, please refer to Mechanics.