Compare Plots
Compare materials data using the plot data. You can also overlay selected materials and compare plots.
-
Select the check box
 of the required materials to compare.
The Compare button is enabled.
of the required materials to compare.
The Compare button is enabled.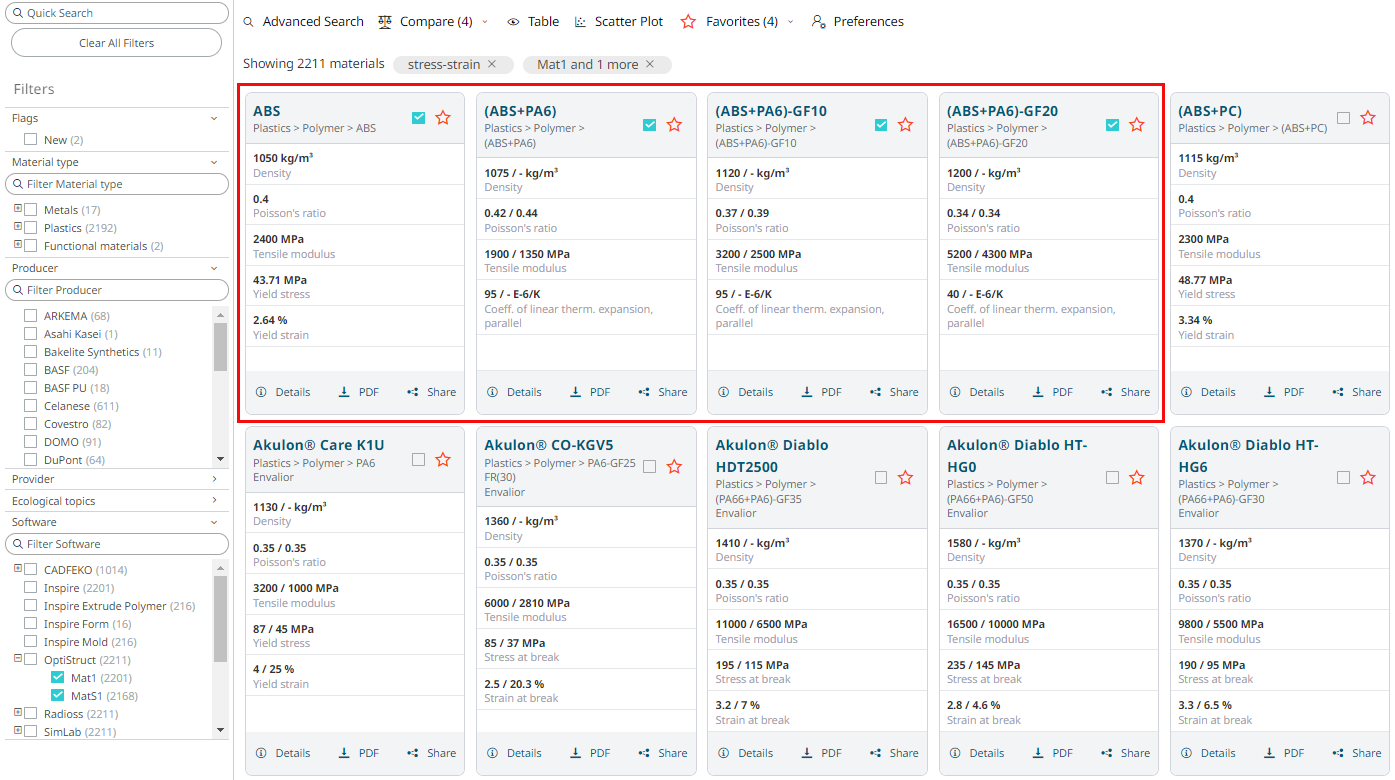 Figure 1. Select Materials to Compare
 -
Click Compare.
The compared material data for the selected materials is displayed in a tabular format.
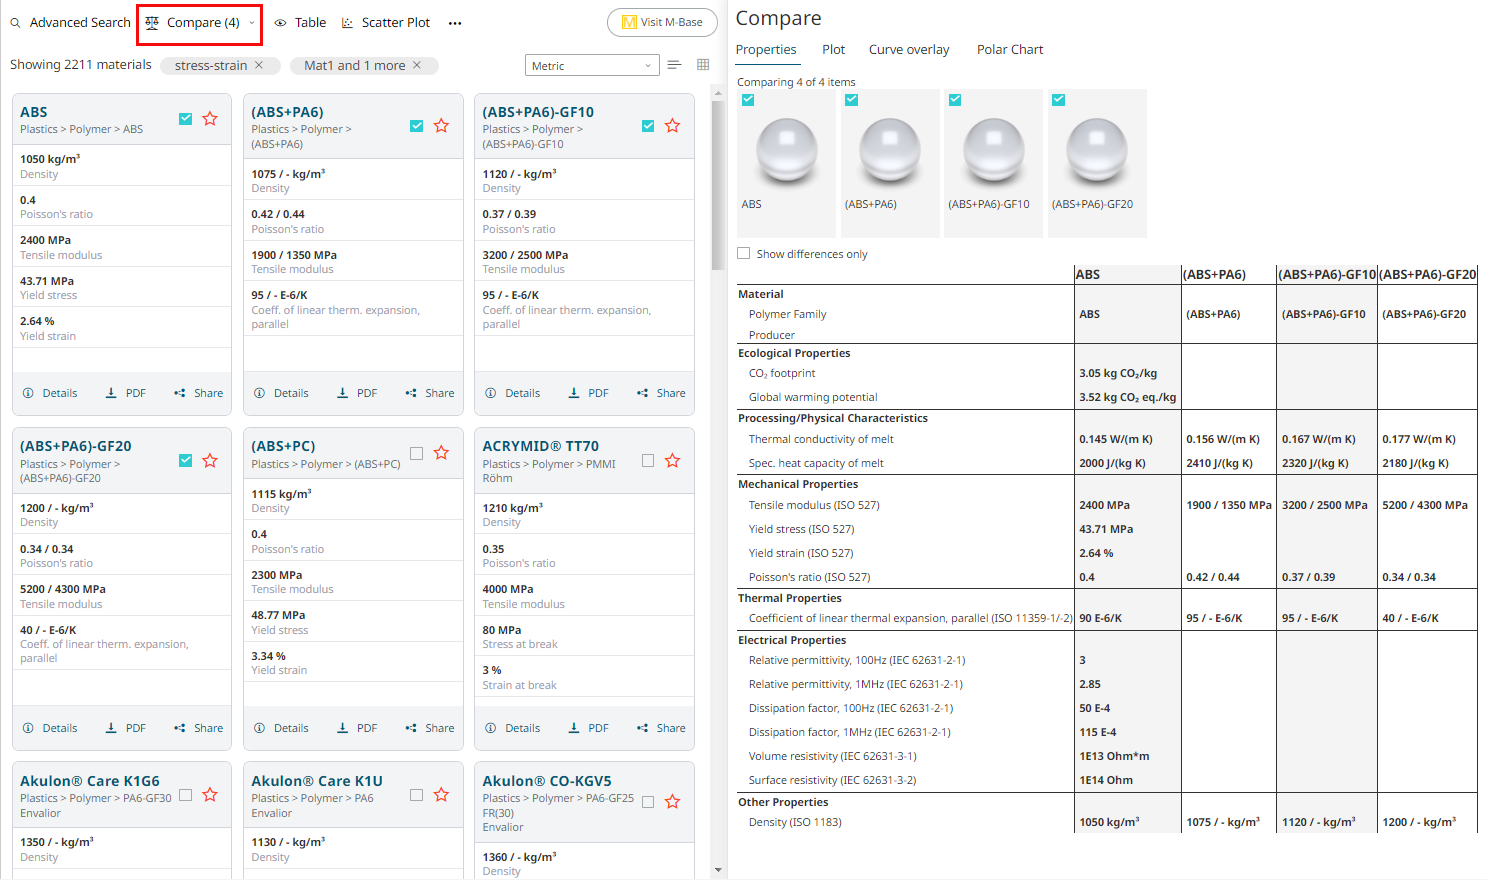
Figure 2. Compared Material Data -
Click Plot.
A list of associated plot data is displayed.
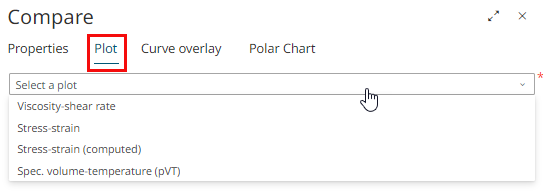
Figure 3. Plot Curves -
Select a plot curve.
The plot data is displayed for all the selected materials.
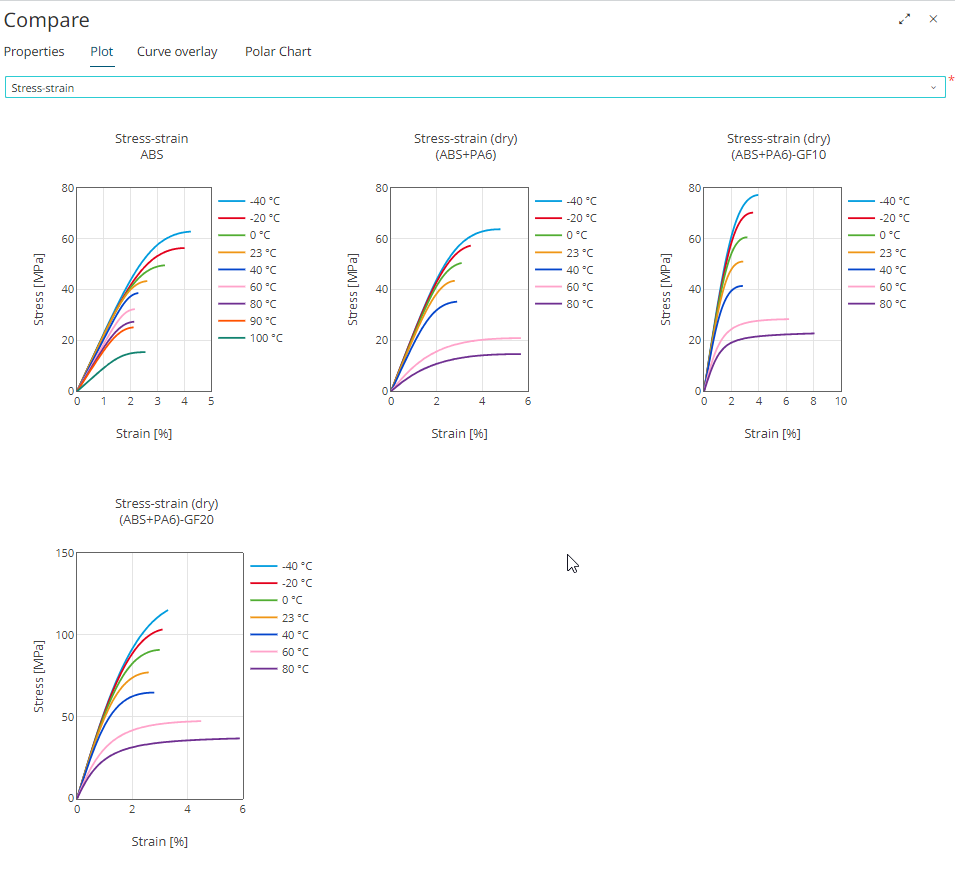
Figure 4. Plot DataNote: If plot is not available for any of the selected material, the following message is displayed: No plot found for material name. -
Click Curve Overlay.
A list of associated plots is displayed.
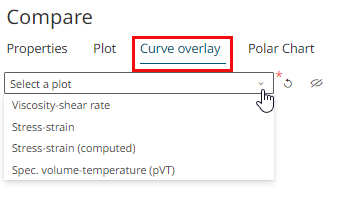
Figure 5. Plot Curves -
Select the required materials to overlay.
Note: Click
 to deselect materials for the same
curve.The plots are overlaid for the selected materials.
to deselect materials for the same
curve.The plots are overlaid for the selected materials.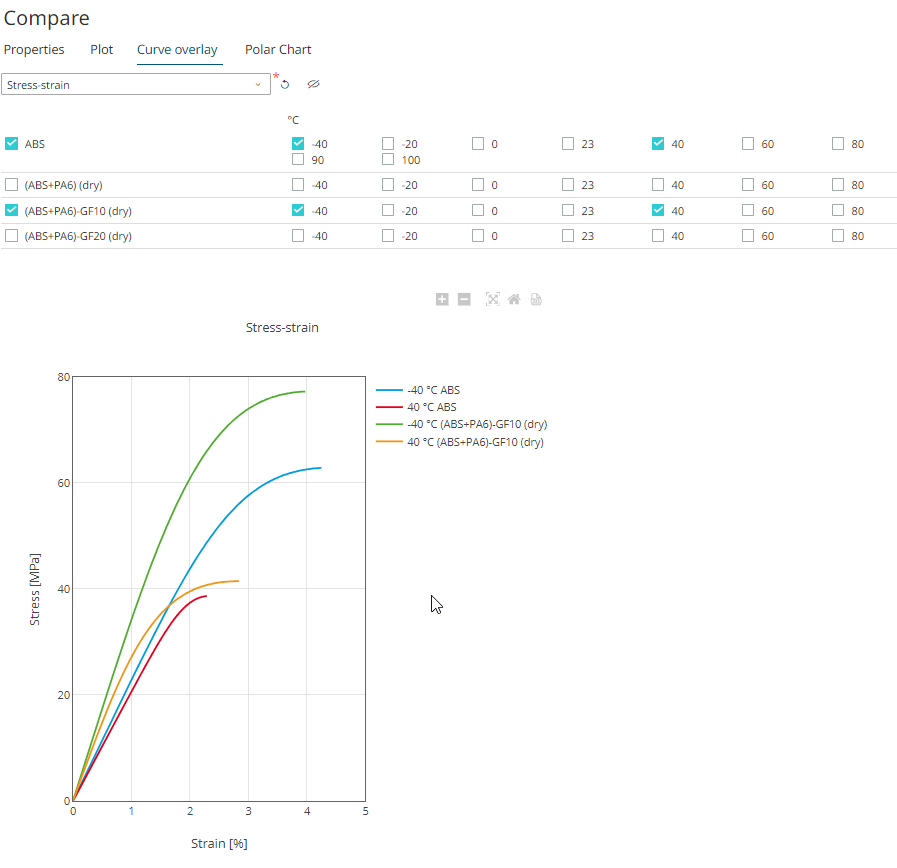
Figure 6. Select Materials and Properties -
Click
 to hide the materials list.
Only the chart data is displayed in the Curve Overlay tab.
to hide the materials list.
Only the chart data is displayed in the Curve Overlay tab.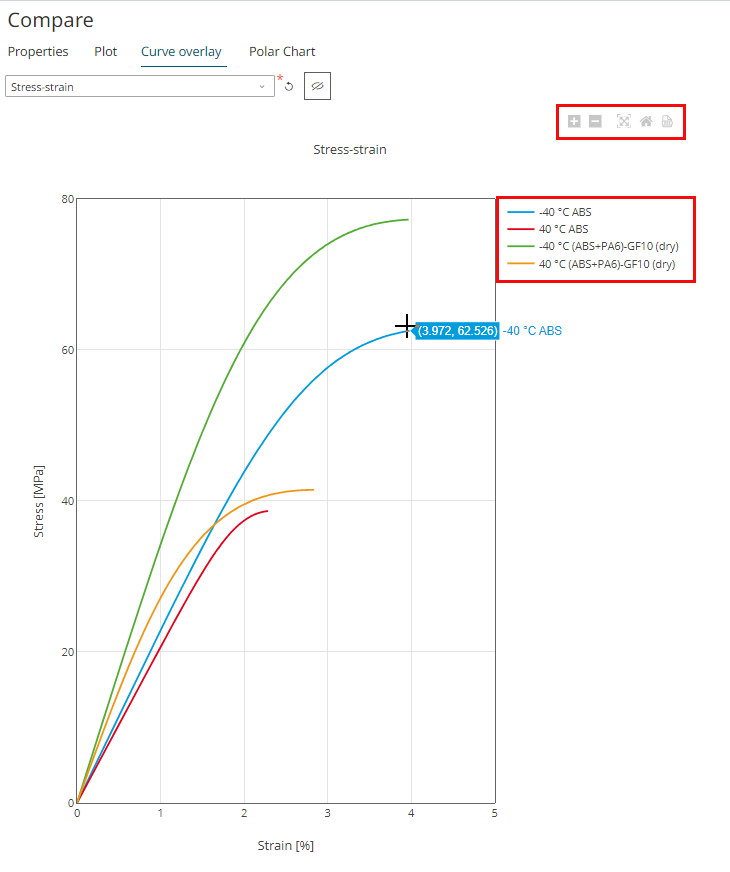
Figure 7. Curve OverlayHover over the plot area to view chart options such as zoom in, zoom out, auto scale to original chart view, reset axis, and export it as a PDF document.
Use the legend to hide or view the curve on the axes.
-
Select the properties of the materials that you wish to compare.
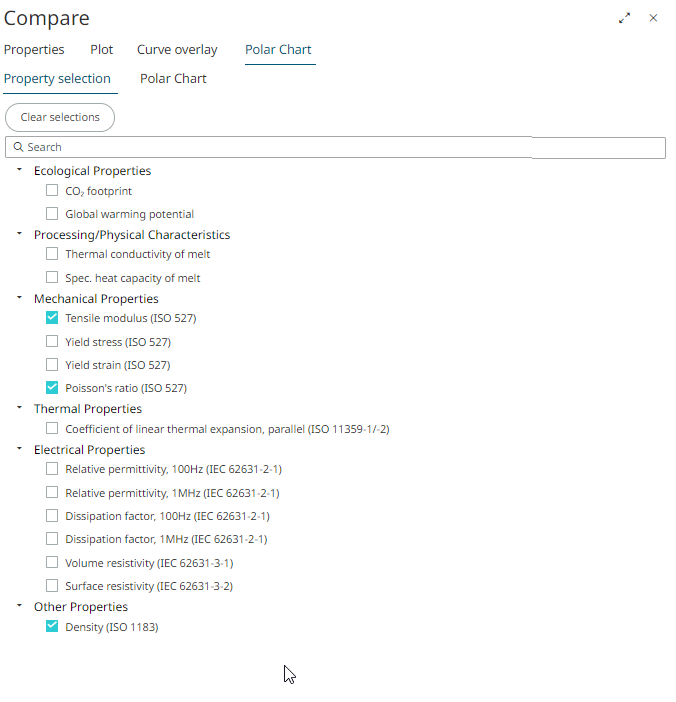
Figure 8. Property Selection -
Click Polar Chart.
The Polar chart is displayed. Each material property is displayed as an axis and its material data values are displayed for comparision.
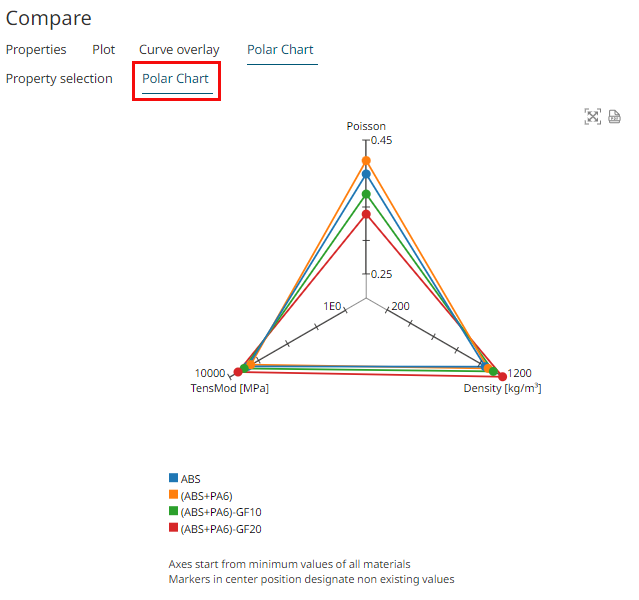
Figure 9. Polar ChartUse
 to auto scale the chart details.
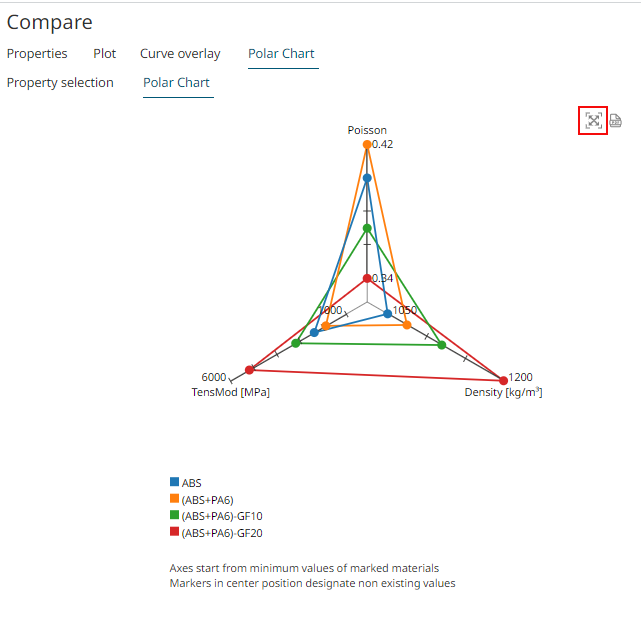 Figure 10. Autoscale Polar Chart
Click
 to export the polar chart data as a PDF
document.
to export the polar chart data as a PDF
document.
For more information, see the following video demonstration: