addaxis
Plots the given dataset on a new vertical axis in an existing 2D plot.
Syntax
[ax, h] = addaxis(y)
[ax, h] = addaxis(x, y)
[ax, h] = addaxis(x, y, x, y, ...)
[ax, h] = addaxis(x, y, fmt)
[ax, h] = addaxis(..., property, value, ...)
[ax, h] = addaxis(hAxes, ...)
Inputs
- x, y
- Range of the x and y axes.
- fmt
- Formatting string for the curve. It can be any combination of the following strings:
- line style: '-', '-.', ':', '--', '-:'.
- line color: 'r', 'g', 'b', 'c', 'y', 'm', 'w', 'k'.
- marker style: 's', 'o', 'd', 'x', 'v', '^', '+', '*', '.'.
- property
- Properties that control the appearance or behavior of the graphics object.
- value
- Value of the properties.
- hAxes
- Axis handle.
Outputs
- ax
- A vector that contains the handle of the Axes object and the handle of the new Y-Axis object.
- h
- Handle(s) of the line graphics object.
Examples
Simple addaxis example:
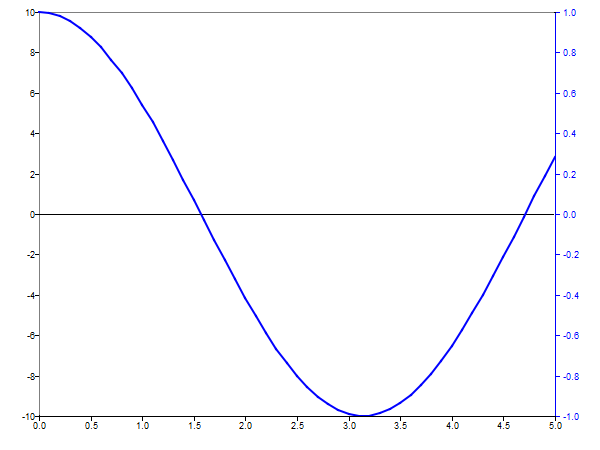 Figure 1. Add axis in new plot.
clf;
[ax, h] = addaxis(0:0.1:5, cos(0:0.1:5));
addaxis in an existing plot:
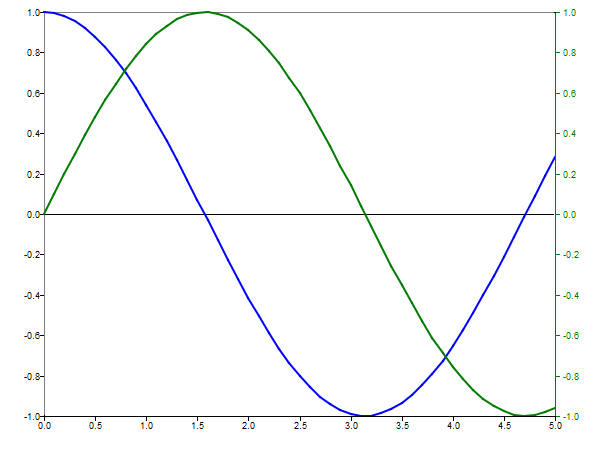 Figure 2. Add a vertical axis in an existing plot.
clf;
x = 0:0.1:5;
plot(x, cos(x));
[ax, h] = addaxis(x, sin(x));
Multiple vertical axes can be added on the right side of the plot:
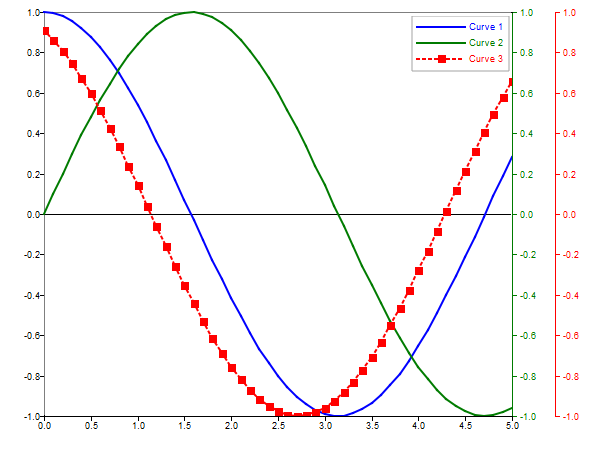 Figure 3. Multiple vertical axes.
clf;
x = 0:0.1:5;
plot(x, cos(x));
[ax1, h1] = addaxis(x, sin(x));
[ax2, h2] = addaxis(x, sin(x+2), ':s');
legend;
Change the appearance of vertical axis:
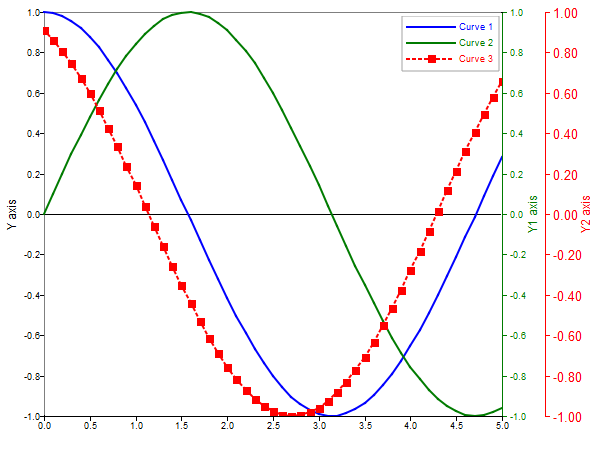 Figure 4. Change the appearance of vertical axis.
clf;
x = 0:0.1:5;
plot(x, cos(x));
[ax1, h1] = addaxis(x, sin(x));
[ax2, h2] = addaxis(x, sin(x+2), ':s');
set(ax2(2), {'fontsize', 'ynumericformat', 'ynumericprecision'}, {10, 'fixed', 2});
ylabel('Y axis');
ylabel(ax1(2), 'Y1 axis');
ylabel(ax2(2), 'Y2 axis');
legend;
The vertical axis that a line is assigned to can be changed:
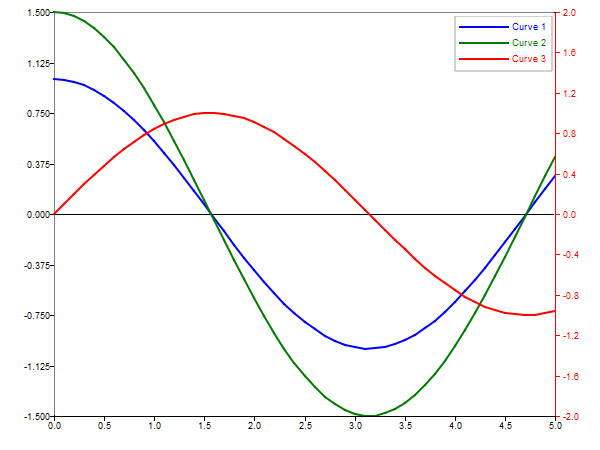 Figure 5. Change the y-axis of a curve.
clf;
x = 0:0.1:5;
h = plot(x, [cos(x); 2*cos(x)]);
[ax, h1] = addaxis(x, sin(x));
set(h(2),'yaxis', ax(2));
ylim([-1.5 1.5]);
ylim(ax(2), [-2 2]);
legend;
Comments
addaxis is available only in 2D X-Y plots.
New vertical axes are positioned on the right side of the plot.
The new vertical axes objects are children of the Axes object. The 'secondaryyaxis' property of the Axes object refers to the first vertical axis on the right side of the plot.
The vertical axis color is the same as the color of the first curve plotted on it.
It is possible to delete a vertical axis and the curves plotted on it using the delete command.