Reports of Monte Carlo Simulation
The traffic simulation report in ProMan based on the Monte Carlo approach that evaluates the numbers of served, blocked and not assigned mobiles (users) for each application and for each cell.
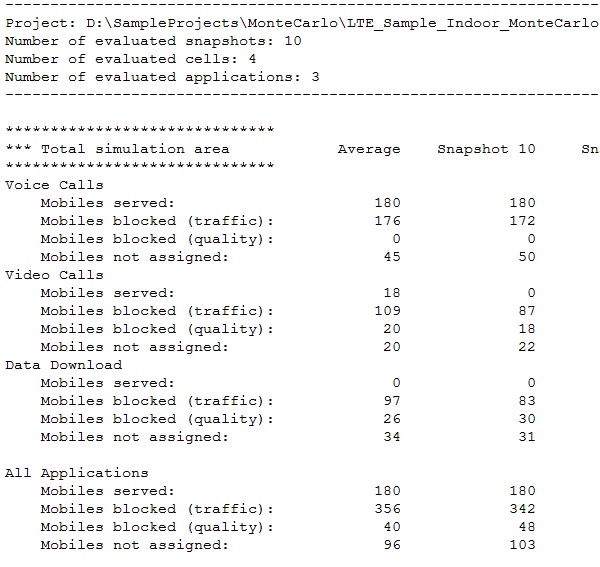
Monte Carlo Simulation Report
The results are given for the total simulation area (considering all cells) and for the sum of all defined applications.
| State | Description |
|---|---|
| Served | The mobile is served by the cell and the corresponding radio resources are allocated for the defined application. |
| Not assigned | Cell assignment not feasible for the corresponding location (signal
level too low and SNIR too low) -white pixels in cell area map.
Note: Coverage holes need to be filled by additional base
stations. |
| Blocked (traffic) | Cell assignment possible for the corresponding location and Rx power as
well as SNIR sufficient for the desired transmission mode. But the required
radio resources are not available in the corresponding cell (for example,
codes in CDMA and time slots in TDMA). Note: Addition of further carriers
required or smaller cell for the hot spot areas. |
| Blocked (quality) | Cell assignment possible for the corresponding location, but for the
desired transmission mode the Rx power and the SNIR is not sufficient
(interference too high). Note: Interference reduction required (modification
of Tx power, antenna pattern or carrier assignment). |
The following example shows a report of a Monte Carlo network simulation with 10 snapshots. Figure 1 shows only the 10th snapshot and average value of all 10 snapshots.
Additional results, on a per-transmitter basis, include transmitter power load in downlink and noise rise in uplink. The transmitter power load in downlink indicates at what percentage of full capacity the transmitter is operating.
The noise rise in uplink is due to mobile devices in neighboring cells that operate on
the same carrier, in other words, mobile devices in interfering cells. For those mobile
devices, the tool knows the locations and the power they transmit to their
base
station. Therefore, the power received from an interfering cell by the base station of
interest is also known. To what extent this power leads to interference depends on which
sub carriers are in use in the cells (mobile devices only interfere if they are on the
same sub carrier). This is included in a probabilistic way depending on the number of
mobile devices in each cell. The noise rise in dB is the difference between the
interfering power and the noise floor. The noise floor is taken to be the thermal
noise.
Monte Carlo Result Maps
Additional result maps for traffic analysis can be created for each defined application. Enable the output of these results by clicking and click the Network tab.
- Traffic Evaluation
- State of generated mobiles for all simulation runs.
- Served Users
- Overall served users at the locations of the generated users for all simulation runs.
- Blocked Users
- Overall blocked users at the locations of the generated users for all simulation runs.
- Offered Traffic
- Overall offered traffic at the locations of the generated users.
- User Distribution
- Overall number of generated users per application within the simulation area.
NUMBER_USERS_GENERATED_EACH_STEP y can be
inserted manually in the project file (.net).