Propagation Paths
ProMan offers the possibility to visualize propagation paths determined during wave propagation prediction.
Propagation paths can be shown in 2D and in 3D view. There are several options to select
the propagation paths to be displayed:
- Display propagation paths on mouse move
- The 2D view showing the propagation paths is updated directly while moving the
mouse cursor within the result data. This option is available by clicking or clicking the
 icon. Clicking the left mouse
button, the propagation paths for the pixel at the current mouse position is
fixed.
icon. Clicking the left mouse
button, the propagation paths for the pixel at the current mouse position is
fixed. - Display propagation paths on mouse click
- This options offers the possibility to show all propagation paths of one or more result pixels after selecting the corresponding locations with the mouse. In this mode the display is not updated while moving the mouse cursor. To select this option, click .
- Show only selected paths for a pixel
- In this mode an individual selection of rays contributing to a selected pixel can
be displayed. Click or click the
 icon. You have to specify the pixel to
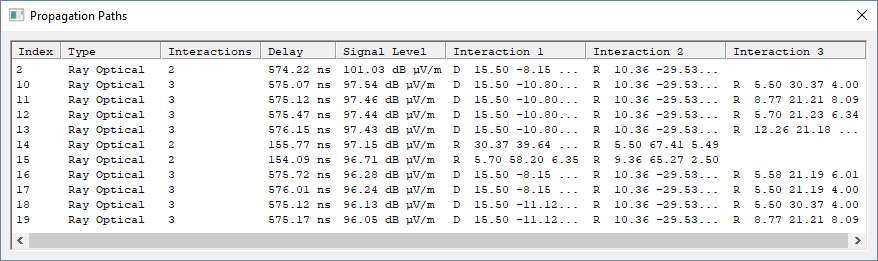
be evaluated. Afterwards, the Propagation Paths dialog opens
where all rays contributing to the selected pixel are listed. In case the
Update display only after mouse click check box is
selected, the ray information listed on the dialog can be updated by clicking on
another pixel. Otherwise the display is updated automatically while moving the
mouse cursor.
icon. You have to specify the pixel to
be evaluated. Afterwards, the Propagation Paths dialog opens
where all rays contributing to the selected pixel are listed. In case the
Update display only after mouse click check box is
selected, the ray information listed on the dialog can be updated by clicking on
another pixel. Otherwise the display is updated automatically while moving the
mouse cursor.
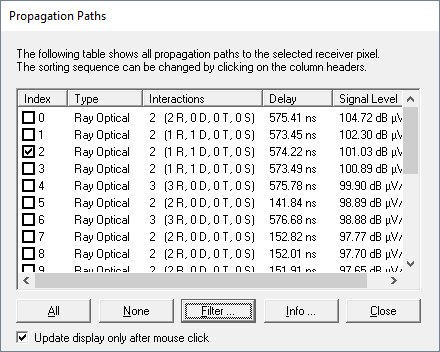
The rays in the list are initially sorted according to decreasing signal level, but the
sorting sequence can be changed by clicking on the column headers. The rays to be displayed
and further evaluated can be selected by selecting the corresponding check box in the index
column. By clicking All or None, all paths of
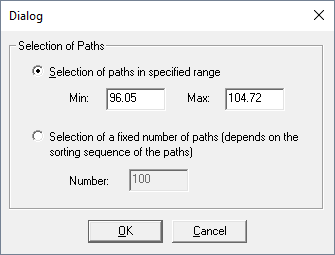
the current pixel can be selected or deselected. The Filter button
makes it possible to select paths in a specified signal level range or to select a fixed
number of paths depending on the sorting sequence.
Tip: Click Spacebar on the
Propagation Paths dialog to toggle the display of the selected
rays in the 2D view.
Further information about the selected paths (for example, the coordinates of the interaction points) can be obtained by clicking Info.
To erase all rays drawn on the display, select or click the ![]() icon.
icon.
Additionally it is also possible to highlight the interactions occurring along the propagation paths with balls. This option can be enabled or disabled by clicking and clicking the Layout tab.
Note: Propagation paths can be analyzed only if the simulation was calculated with a
ray-optical propagation model and the additional ray data output was enabled. While loading
the result file, you will be asked to load additionally available data. This question has
to be answered with yes to do analysis of the radio channel.
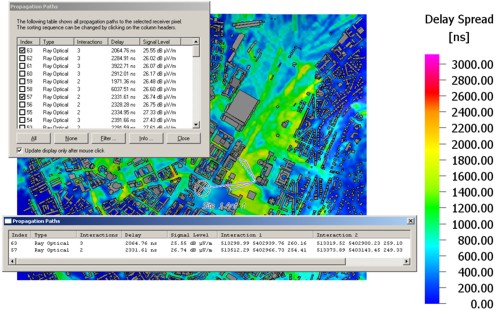
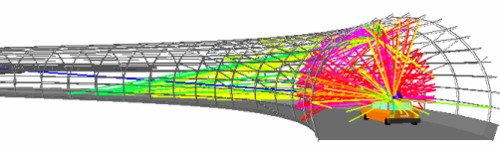
Examples
Ray data evaluation in urban environment: