Values Along a Line
Result data can be evaluated along arbitrary lines within the simulation area.
Arbitrary sampling distances can be selected. You can draw a line between two points with
the mouse. Click or the ![]() icon, click the left mouse button and keep
the mouse button pressed until the end of the line is reached.
icon, click the left mouse button and keep
the mouse button pressed until the end of the line is reached.
Another option is to draw a line using the transmitter location for the first point of the
line. Click or click the ![]() icon, you have the choice to define the
second point of the line with the mouse or to enter the coordinates in a dialog.
icon, you have the choice to define the
second point of the line with the mouse or to enter the coordinates in a dialog.
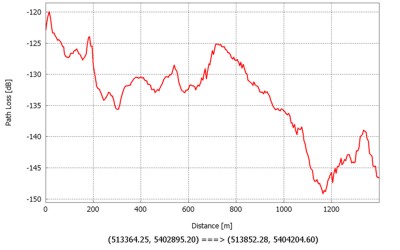
Example
This example show the predicted path loss on a line between two points of the simulation area: