Viewing the Differences in Prediction Results
Display the difference between the two sets of prediction results obtained using the multi-wall model (COST 231) and the 3D ray tracing (SRT) model.
-
Subtract the data using one of the following workflows:
- On the Edit menu, click .
- Press Alt+4 to use the keyboard shortcut.
- Browse to the folder that contains the multi-wall model (COST 231) results as specified in Step 2.
-
Select the Site 1 Ant 1 Power.fpp file and click
Open.
Figure 1. Difference between the predicted received power using the multi-wall model (COST 231) and 3D ray tracing (SRT) model. 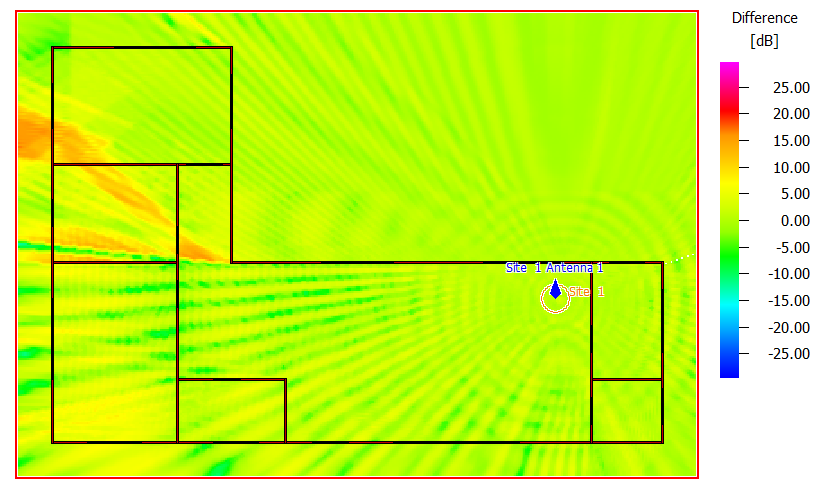
Note: Main difference between models are visible in the deep shadows (indicated by the red areas). Contributions through diffraction are significant.