FMCW
When the user selects a simulation of type Doppler and defines the Doppler parameters including FMCW, this option will be visible on the ‘Show Results --> Doppler’ option of the menu bar.
This option allows the user to visualize the spectrum of the field for one time or more times in the signal periods. Then, selecting a determinate instant of time, the user can see the Doppler Spectrum. The user can select one or more instants of time over all the periods simulated.
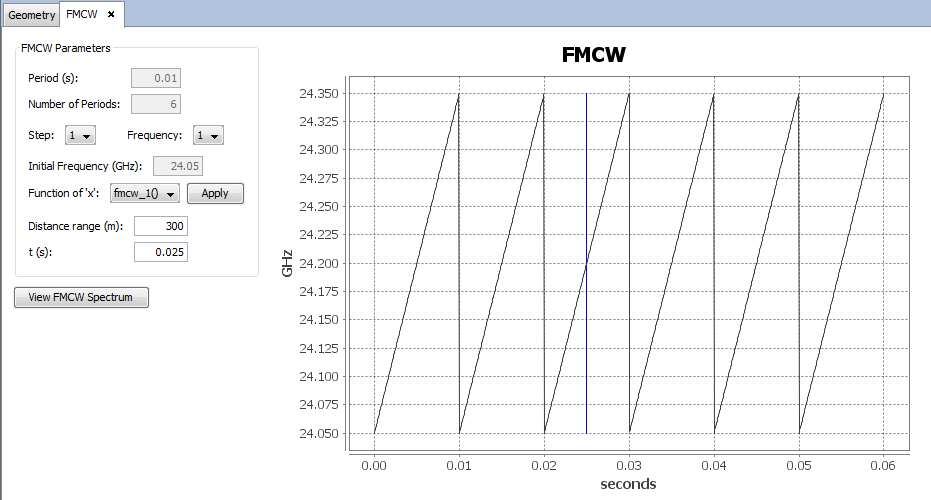
- Period indicates, on seconds, the period duration on time. This parameters is configured in section Doppler.
- Number of periods indicates the number of repeats for the frequency variation. This parameters is configured in section Doppler.
- Step select the parametric scene to realize the analysis.
- Frequency select the carrier frequency for the analysis. This frequency will be one of the simulation frequencies.
- Initial Frequency indicates, on GHz, the frequency selected to be the carrier frequency.
- Function of 'x' assign the user function frequency signal.
- Distance Range indicates, on meters, the maximum distance considered in the simulation that rays can travel from transmitter to receptor including rebounds with obstacles.
- t(s) allows to add instant of time to analyze. Selecting an instant of time, in seconds, and clicking on the ‘Add’ button (green icon with the plus sign) the instant will be added to the analyzing list. Selecting a row from the list and clicking on the ‘Delete’ button (red ‘X’ icon) the selected instant will be removed from the analyzing list.
The frequency signal can be defined by a user function, where the x coordinate is the time in seconds. These functions are defined without parameters and return a double data type. These functions can use the $x variable, which is assigned the value of time in seconds and $period variable that equals the period value. The $x variable is always less or equal than $period.
The application includes by default five user functions for usage in FMCW. They are in the functions directory.
Sawtooth wave (fmcw_1.java):
doublefmcw_1(){
// This function returns the frequency increment from time '$x'
// Global parameters
// $period period time in seconds.
// $x time within the period.
//
// Note '$x' it is always less than '$period'
//
doubleMAX_BROADBAND=0.3;// GHz
return($x*MAX_BROADBAND)/$period;}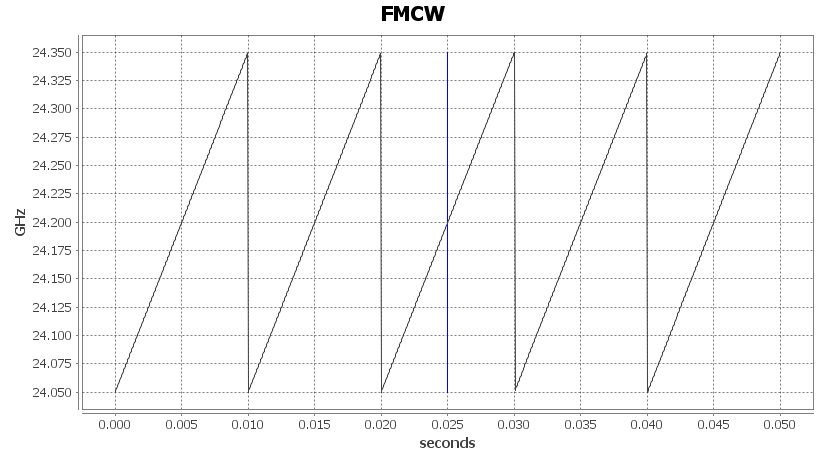
Square wave (fmcw_2.java):
doublefmcw_2(){
// This function returns the frequency increment from time '$x'
// Global parameters
// $period period time in seconds.
// $x time within the period.
//
// Note '$x' it is always less than '$period'
//
doublex1=1./3*$period;doublex2=2./3*$period;if($x<x1){return0.0;}elseif($x<x2){return0.1;}else{return0.2;}}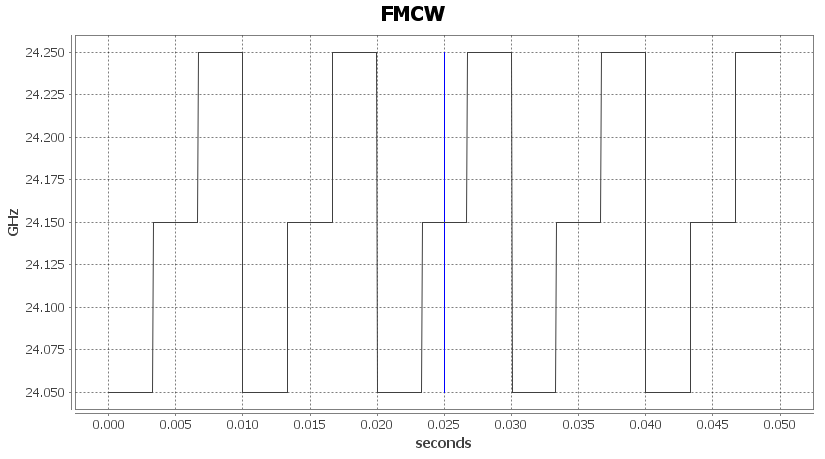
Range wave (fmcw_3.java):
doublefmcw_3(){
// This function returns the frequency increment from time '$x'
// Global parameters
// $period period time in seconds.
// $x time within the period.
//
// Note '$x' it is always less than '$period'
//
doublex1=1./3*$period;doublex2=2./3*$period;doublex3=$period;doubley1=0.1;doubley2=0.2;if($x<x1){returny1/x1*$x;}elseif($x<x2){returny1;}else{returny1+((y2-y1)/(x3-x2))*($x-x2);}}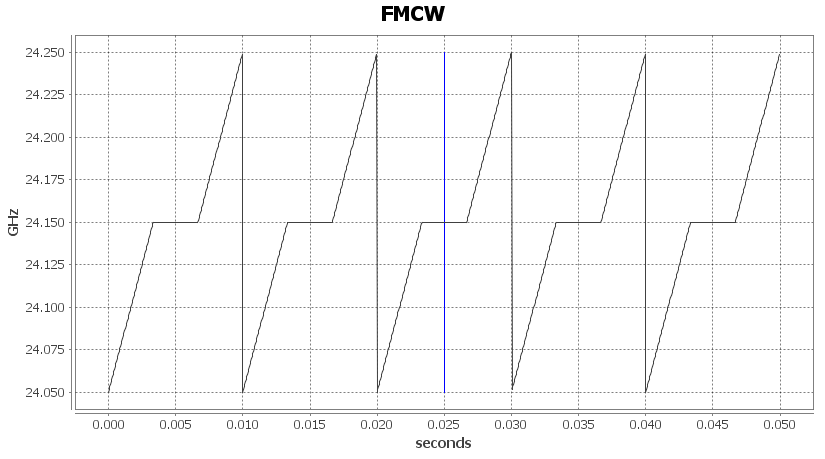
Triangular wave (fmcw_4.java):
doublefmcw_4(){
// This function returns the frequency increment from time '$x'
// Global parameters
// $period period time in seconds.
// $x time within the period.
//
// Note '$x' it is always less than '$period'
//
doubleBROADBAND=0.3;// first point
doublex0=0;doubley0=0;// second point
doublex1=1./2*$period;doubley1=BROADBAND;// third point
doublex2=$period;doubley2=0;if($x<x1){doublepending=(y1-y0)/(x1-x0);doublexOffset=x0;doubleyOffset=y0;returnpending*($x-xOffset)+yOffset;}else{doublepending=(y2-y1)/(x2-x1);doublexOffset=x1;doubleyOffset=y1;returnpending*($x-xOffset)+yOffset;}}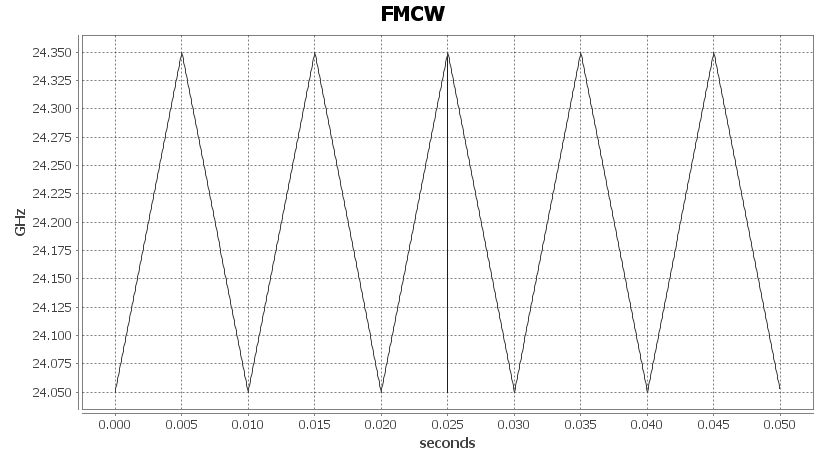
Sinusoidal wave (fmcw_5.java):
doublefmcw_5(){
// This function returns the frequency increment from time '$x'
// Global parameters
// $period period time in seconds.
// $x time within the period.
//
// Note '$x' it is always less than '$period'
//
doubleBROADBAND_GHZ=3.0e-3;// change [0, $period] range to [0, 2*PI] range
doubleradians=($x*(Math.PI*2))/$period;returnMath.sin(radians)*BROADBAND_GHZ;}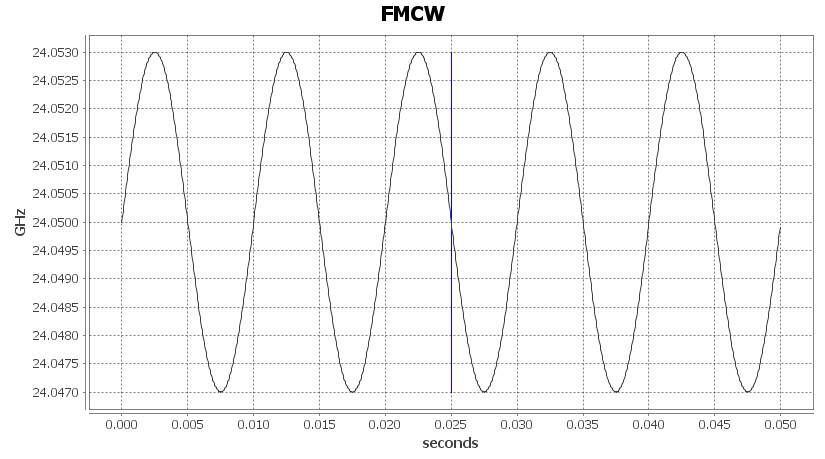
See further information in User Functions.
When all the previous parameters will be defined, clicking on "View FMCW Spectrum" button, the spectrum chart appears.

To save the data table values click on the ‘Save as...’ button and select the path for the file.
This chart indicates, for each frequency on the broadband, the contribution of the rays emitted in the frequency and came to the receptor at time ‘t’. The frequency values on X-axis will be indicated referenced to the current frequency (‘Ft’) on the analyzing instant, then a contribution of -2000 Hz means a contribution of a rays emitted to 2000 Hz below of the current frequency.

- t: Indicates the instant of time that ‘Time’ parameter referenced.
- Ft: indicates the current frequency. This frequency is the frequency on the instant of time ‘t’.
- Bin: divides the spectrum and modifies the beat signal frequency domain and the beat signal time domain charts.

