Near Field
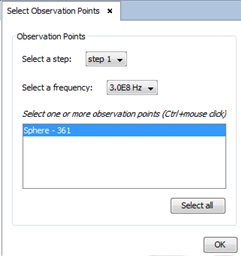
When this option is selected, the following panel will appear:

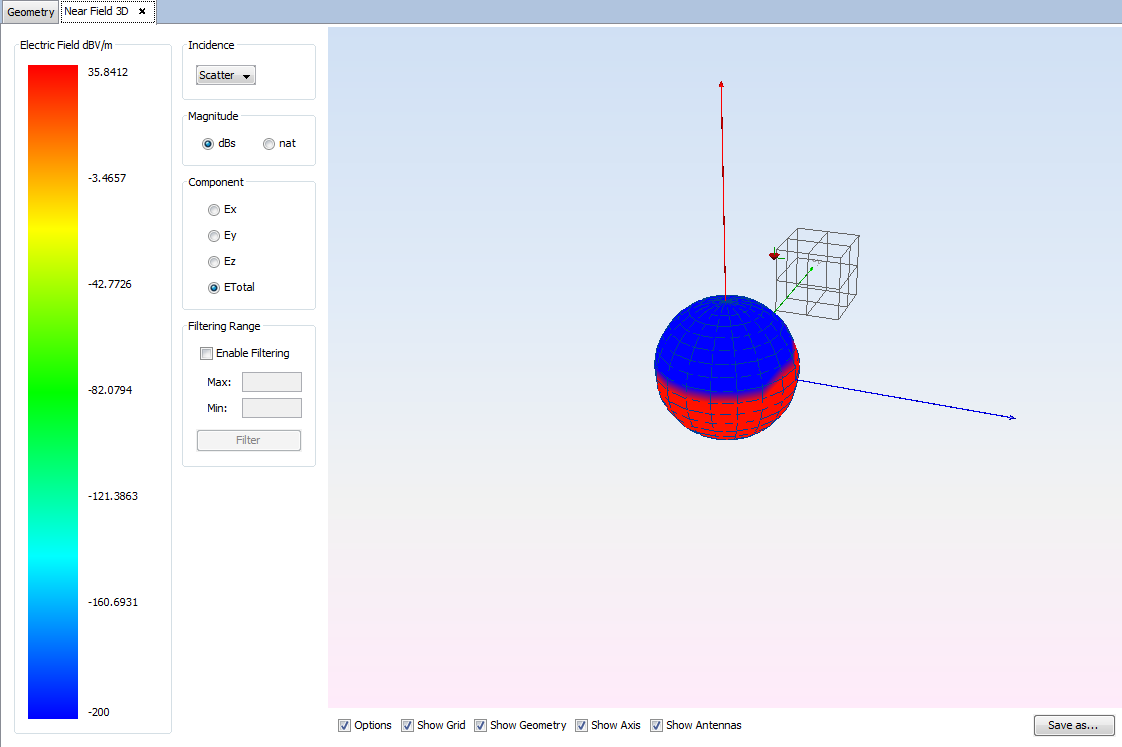
In this panel, the user can select a step, a frequency (from the set of sampled frequencies) and a set of observation points (holding the Ctrl key, the user can select more than one item from the list). When the user presses the OK button, the following window will be opened, showing a 3D diagram of the near field values on the selected observation points:

When initially open, the panel will display a default series in the plot that will represent the measurements for a particular component and field in dBo natural magnitude. Different values can be visualized by changing the parameters in the control panel.
- Incidence: the type of field to inspect. Select one of the possible values Direct, Scatter, Total.
- Magnitude: dB o natural.
- Component: the field component to inspect. Select one of the possible values Ex, Ey, Ez, Etotal.
- Filter: enable the filter check box and select a particular maximum and minimum to filter the values that will be plotted.