The Data Query panel uses vertical cutting surfaces for viewing and plotting
non-planer cross sections.
From the 3D Chart ribbon, click the Data Query
tool. Figure 1.
Figure 2.
Surfaces can be defined by math expressions, specifying orders, and selecting points
on the waterfall plot or 3-D surface plot.
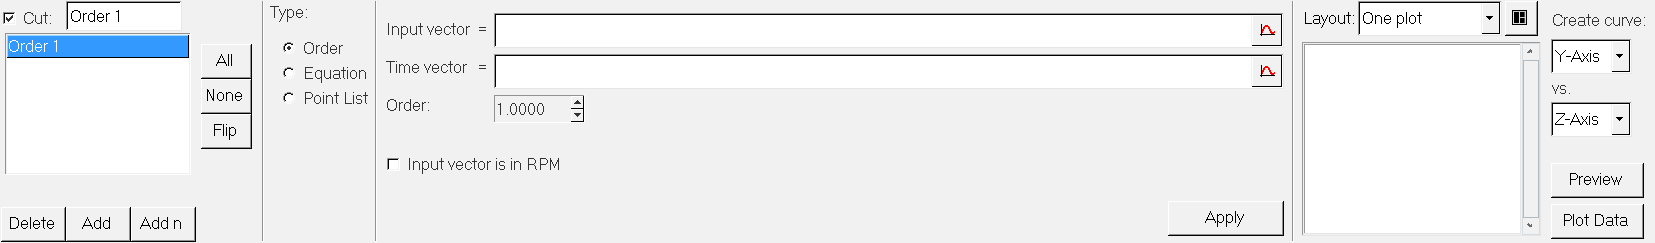
Cut List
The Cut list lists the vertical cutting surfaces contained in the plot, or new
queries that are added to the current plot. The currently selected vertical cutting
surface is displayed in the Cut text field. Select or deselect the check box to
activate the vertical cutting surface displayed in the Cut text field.
All
Selects every query in the list
None
Deselects all highlighted queries in the list.
Flip
Exchanges the currently selected queries for the unselected queries in
the list.
Delete
Deletes a section query.
Add
Adds a new section query.
Add n...
Adds a specific number of queries.
Type
Select the type of query that you want to create.
Order
Passes a query surface through an order.
Input vector
XY vector which contains the driving or input vector for the
waterfall plot.
Time vector
XY vector which defines the time values used to create the
waterfall plot.
Order
Select the order that you want to query. You can enter the
values manually or left-click on an order in the waterfall
plot.
Input vector is in RPM
Select this option to scale the response curve by 60 to use
RPS.
Apply
Click Apply to create/update the
query surface.
Equation
A math equation defining a curve on an XY plane.
X
Math expression on the XY plane, along the X axis.
Y
Math expression on the XY plane along the Y axis.
Point List
Create a curve on the XY plane by picking the X, Y, and Z points.
X, Y, Z
Click in the X, Y, and Z fields to enter values.
Add Row
Click Add Row to add a row to the
table.
Delete Row
Select a row and click Delete Row to
delete the row from the table.
Clear Table
Clear the contents of the table.
Move Arrows
Use the up and down arrows to move between rows.
Layout
Layout
The Layout option allows you to specify how the plotted data is arranged
on a page.
One plot
Data is arranged on one plot.
One plot per cut
One plot is created for each vertical cutting surface. The
Page Layout button is activated when you select this option.
Choose a page layout type from the pop-up dialog.
New plot
Curves are plotted in a new plot window.
Create curve
Creates an XY curve of the 3D plot cross section.
Use the two drop-down menus under Create curve to define the independent
and dependent vectors for the XY curve. Both menus contain the same
options: X, Y, and Z.
X, Y, and Z are the X, Y, and Z values in the 3D plot.
Select an option from the first drop-down menu to define the independent
vector, then go to the second drop-down menu and select an option to
define the dependent vector. Click Plot Data to
create the plot.