HS-1060: Link Variables of a Model to Output Responses of Other Models
Learn how to link variables of a model to output responses of other models.

Figure 1. Double Symmetric Plate Model
Perform the Study Setup
- Start HyperStudy.
-
Start a new study in the following ways:
- From the menu bar, click File > New.
- On the ribbon, click
 .
.
- In the Add Study dialog, enter a study name, select a location for the study, and click OK.
- Go to the Define Models step.
-
Add a Parameterized File model.
-
From the Directory, drag-and-drop the
plate.tpl file into the work area.
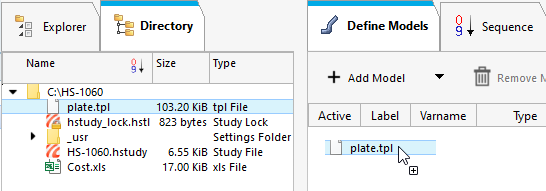
Figure 2. -
In the Solver input file column, enter
plate.fem.
This is the name of the solver input file HyperStudy writes during any evaluation.
- In the Solver execution script column, select OptiStruct (os).
-
From the Directory, drag-and-drop the
plate.tpl file into the work area.
-
Add a Spreadsheet model by dragging-and-dropping Cost.xls
file from the Directory into the work area.
The Resource, Solver input file, and Solver input arguments fields become populated. The Solver input file field displays hst_input.hstp, this is the name of the solver input file HyperStudy writes during an evaluation.Note:
When you create an Excel spreadsheet model, it is important that the spreadsheet is formatted correctly. A variable's value and label can be formatted in two consecutive rows or two consecutive columns. Variable labels should only contain English characters, or a combination of English characters and numbers. If a label is not created for a variable, HyperStudy will assign one by default.

Figure 3. -
Click Import Variables.
The cost.xls spreadsheet opens.
-
Add input variables.
- In the Excel dialog, click Yes to begin selecting input variables.
-
In the spreadsheet, select the cells that contain the input variable's
labels and values.

Figure 4. - In the Excel dialog, click OK.
- Click Cancel to stop selecting input variables.
-
Add output responses.
- In the Excel dialog, click Yes to begin selecting output responses.
-
In the spreadsheet, select the cells that contain the output response's
label and value.
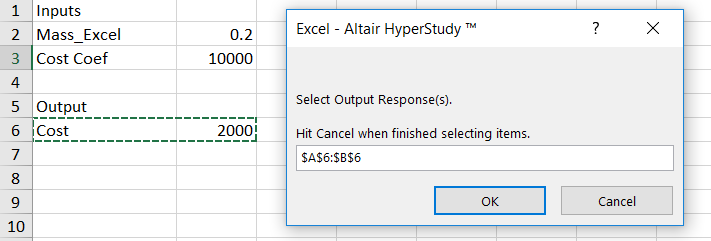
Figure 5. - In the Excel dialog, click OK.
-
Click Cancel to stop selecting output
responses.
Two input variables and one output response are imported from the cost.xls spreadsheet.
- Go to the Define Input Variables step.
- Review the input variable's upper and lower bound ranges.
Perform Nominal Run
- Go to the Test Models step.
-
Click Run Definition.
An approaches/setup_1-def/ directory is created inside the study Directory. The approaches/setup_1-def/run__00001/m_1 directory contains the input file, which is the result of the nominal run.
Create and Evaluate Output Responses
In this step you will create output responses, Mass and Displacement.
- Go to the Define Output Responses step.
-
Create the Mass output response.
-
From the Directory, drag-and-drop the
plate.out file, located in
approaches/setup_1-def/run__00001/m_1, into the
work area.
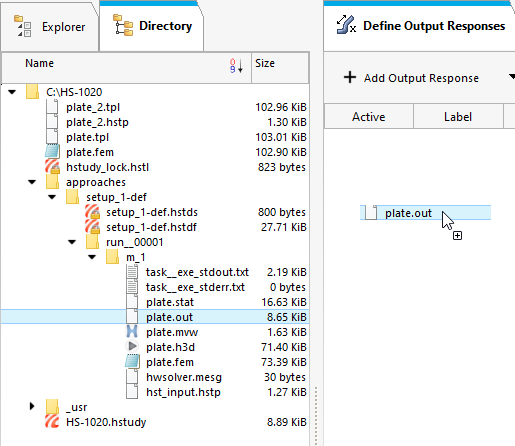
Figure 6. - In the File Assistant dialog, set the Reading technology to Altair® HyperWorks® and click Next.
- Select Single Item in a Time Series, then click Next.
-
Define the following options, then click Next.
- Set Type to Mass.
- Set Request to Mass.
- Set Component to Value.
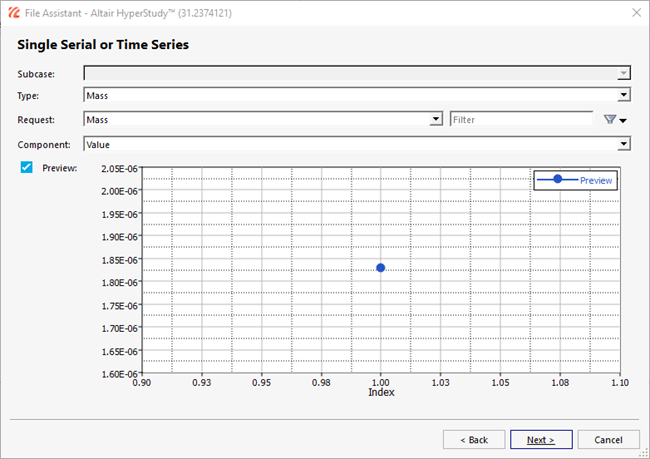
Figure 7. - Label the output response Mass.
-
Set Expression to First Element.
Note: Because there is only a single value in this data source, [0] is inserted after m_1_ds_1, thereby choosing the first (and only) entry in the data source.
-
Click Finish.
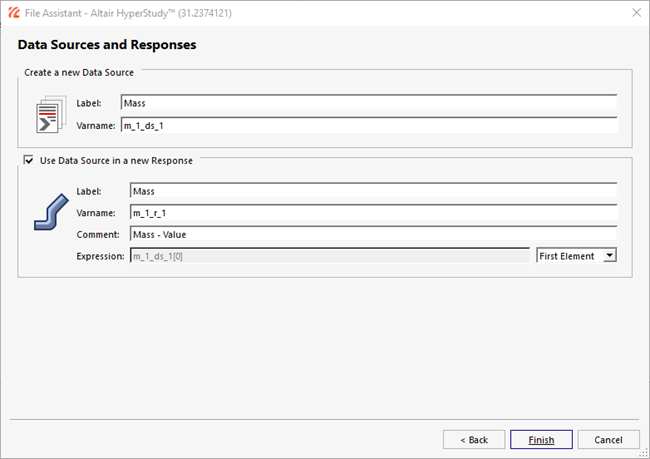
Figure 8.
The Mass output response is displayed in the work area. -
From the Directory, drag-and-drop the
plate.out file, located in
approaches/setup_1-def/run__00001/m_1, into the
work area.
-
Create the Displacement output response.
- From the Directory, drag-and-drop the plate.h3d file, located in approaches/setup_1-def/run__00001/m_1, into the work area.
- In the File Assistant dialog, set the Reading technology to Altair® HyperWorks® and click Next.
- Select Single Item in a Time Series, then click Next.
-
Define the following options, and then click Next.
- Set Subcase to Subcase 1 (Load).
- Set Type to Displacement (Grids).
- Set Request to N298.
- Set Component to MAG.
- Label the output response Displacement.
- Set Expression to First Element.
- Click Finish.
The Displacement output response is added to the work area. - Click Evaluate to extract the response values.
Link Input Variables to Output Responses
In this step you will link Mass_Excel input variable of Model 2 to Mass output response of Model 1.
- In the Explorer, click Define Input Variables.
- Click the Links tab.
-
In the Expression column of the input variable Mass_Excel, click
 .
.
- In the Expression Builder, click the Output Responses tab.
- Select the output response Mass.
-
Click Insert Varname.
The expression m_1_r_1 appears in the Evaluate Expression field.
-
Click OK.
The input variable Mass_Excel of Model 2 is now linked to the output response Mass of Model 1.

Figure 9. -
Perform a System Bounds Check and verify that the input variable Mass_Excel is
equal to the output response Mass.
- In the Explorer, right-click and select Add from the context menu.
- In the Add dialog, select Basic and click OK.
- Go to the Basic 1 > Specifications step.
- In the work area, set the Mode to System Bounds Check.
- Click Apply.
- Go to the Evaluate step.
- Click Evaluate Tasks.
-
Click the Evaluation Data tab and verify that
the input variable Mass_Excel is equal to the output response
Mass.

Figure 10.