Examples#
HyperView Examples#
Example 01 - Contour Model and Export#
Load model, contour composite stress and export H3D / PNG#1from hw import * 2from hw.hv import * 3import os 4 5scriptDir = os.path.abspath(os.path.dirname(__file__)) 6modelFile = os.path.join(scriptDir,'aerobox','aerobox.fem') 7resultFile = os.path.join(scriptDir,'aerobox','aerobox-LC1-2.op2') 8h3dFile = os.path.join(scriptDir,'demo_model_export.h3d') 9jpgFile = os.path.join(scriptDir,'demo_image_export.jpeg') 10 11ses = Session() 12ses.new() 13win=ses.get(Window) 14win.type = 'animation' 15 16win.addModelAndResult(modelFile, result=resultFile) 17res = ses.get(Result) 18resScalar = ResultDefinitionScalar(dataType='Composite Stress',dataComponent='vonMises',layer='Max') 19res.plot(resScalar) 20 21exportH3D = ExportModelH3D(animation=True, 22 previewImage=False, 23 compressOutput=True, 24 compressionLoss=0.05, 25 file=h3dFile) 26 27captureImage = CaptureImageTool(type = 'jpg', 28 width = 3000, 29 height = 2000, 30 file=jpgFile) 31 32animTool=AnimationTool() 33animTool.currentFrame=1 34 35evalHWC('view orientation iso') 36exportH3D.export() 37captureImage.capture()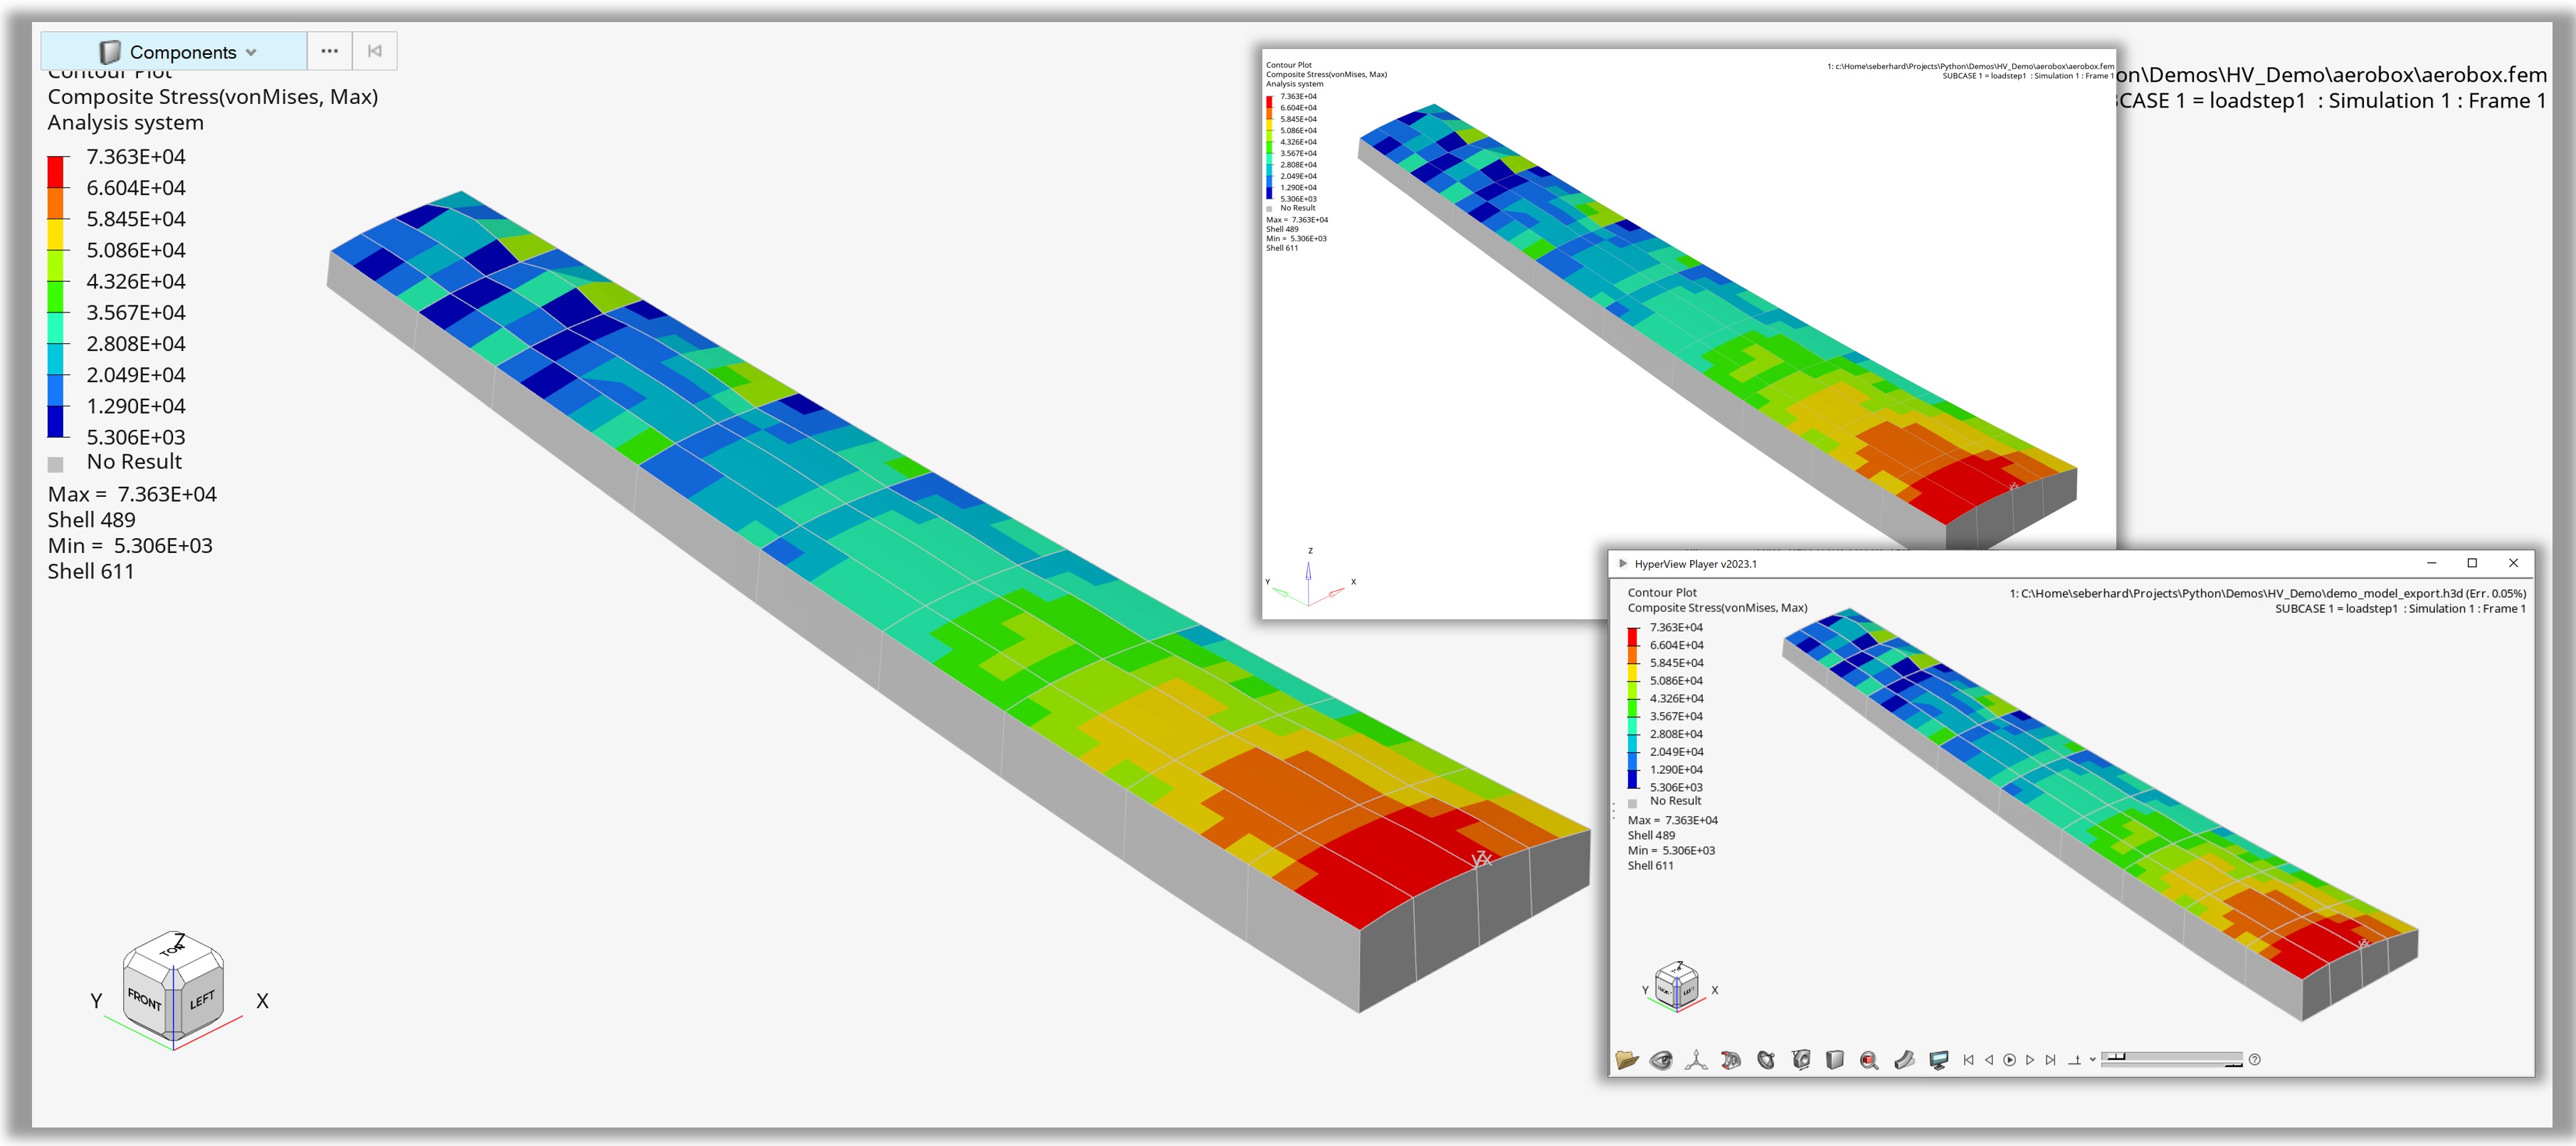
Figure 1. Output of ‘Contour Model and Export’
Example 02 - Part lists with Collections and evalTcl()#
Part lists with Collections and evalTcl() postquery#1from hw import * 2from hw.hv import * 3import os 4 5scriptDir = os.path.abspath(os.path.dirname(__file__)) 6modelFile = os.path.join(scriptDir,'aerobox','aerobox.fem') 7resultFile = os.path.join(scriptDir,'aerobox','aerobox-LC1-2.op2') 8 9ses = Session() 10ses.new() 11page=ses.get(Page) 12win=ses.get(Window) 13win.type = 'animation' 14win.addModelAndResult(modelFile, result=resultFile) 15animTool=AnimationTool() 16animTool.currentFrame=1 17evalHWC('view orientation iso') 18 19print() 20print('Part lists by evalTcl() with postquery package') 21evalTcl('package require postquery') 22partList=[int(x) for x in evalTcl('::hwp::getComponentList').split()] 23print('Part ID List = ',partList) 24partNameList=evalTcl('::hwp::getComponentList -byname 1').split() 25print('Part Name List = ',partNameList) 26 27print() 28print('Part lists by Collections') 29partCol=Collection(Part) 30partList = [p.id for p in partCol.getEntities()] 31print('Part ID List = ',partList) 32partNameList = [p.name for p in partCol.getEntities()] 33print('Part Name List = ',partNameList)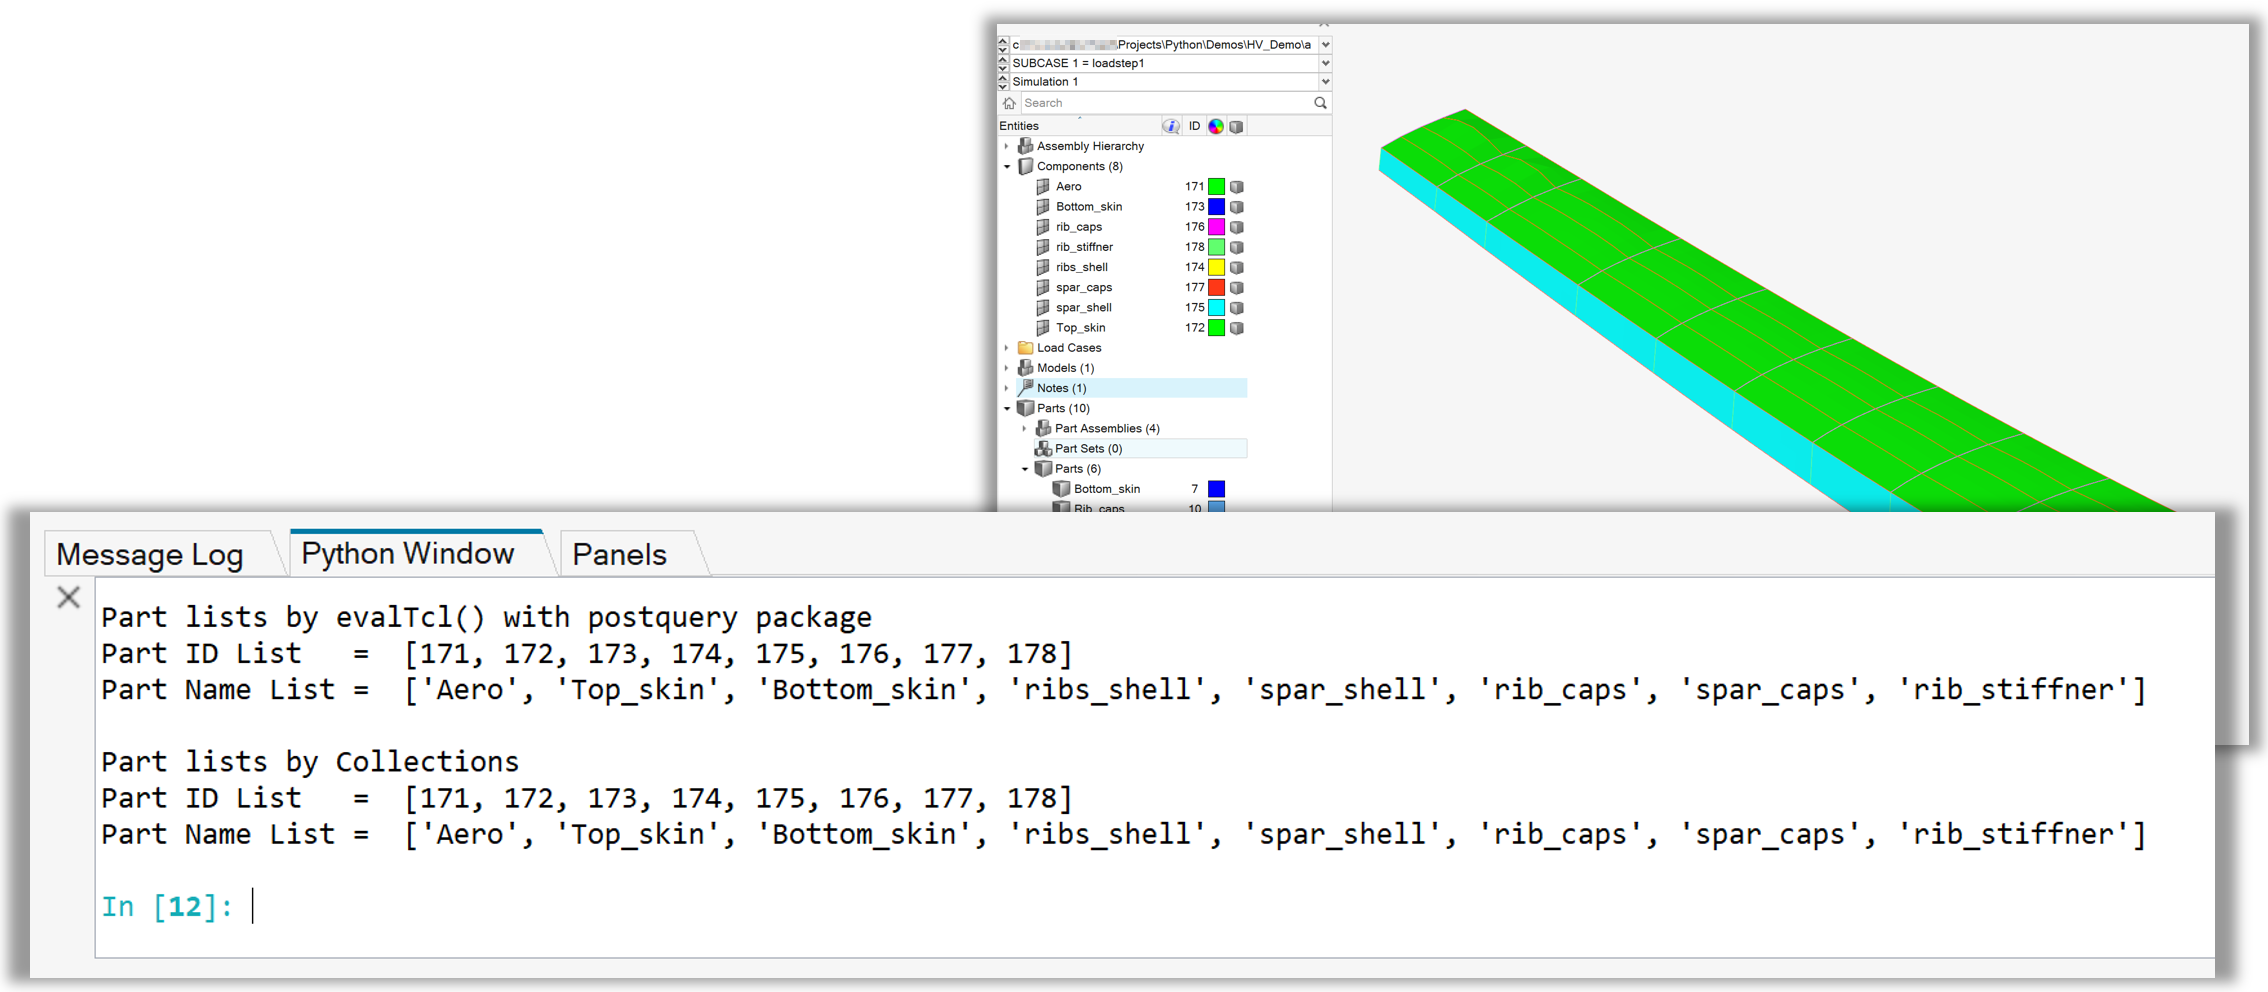
Figure 2. Output of ‘Part lists with Collections and evalTcl() postquery’
Example 03 - Macro wiht GUI#
Macro with GUI, loop over results, export of images and H3D#1from hw import * 2from hw.hv import * 3from hwx.xmlui import gui 4from hwx import gui as gui2 5import os 6import itertools 7 8def MyCustomGui(): 9 10 # Method called on clicking 'Close'. 11 def onClose(event): 12 dialog.Hide () 13 14 def onRun(event): 15 dialog.Hide () 16 postprocAuto(modelFile.value, resultFile.value, folderSel.value) 17 gui2.tellUser('Done!') 18 19 label1 = gui.Label(text='Model File') 20 modelFile = gui.OpenFileEntry(placeholdertext='Model File') 21 label2 = gui.Label(text='Result File') 22 resultFile = gui.OpenFileEntry(placeholdertext='Result File') 23 label3 = gui.Label(text='Screenshot Folder') 24 folderSel = gui.ChooseDirEntry(tooltip='Select output directory') 25 26 close = gui.Button ('Close', command=onClose) 27 create = gui.Button ('Run', command=onRun) 28 29 # Default file settings for quick demo purposes 30 if True: 31 src_path = os.path.dirname(os.path.abspath(__file__)) 32 modelFile.value = os.path.join(src_path, "aerobox", "aerobox.fem").replace("\\","/") 33 resultFile.value = os.path.join(src_path, "aerobox", "aerobox-LC1-2.op2").replace("\\","/") 34 folderSel.value = os.path.join(src_path, "outDir").replace("\\","/") 35 36 mainFrame = gui.VFrame ( 37 (label1, 20, modelFile), 38 (label2, 20, resultFile), 39 (label3, 20, folderSel), 40 (create,close) 41 ) 42 43 dialog = gui.Dialog(caption = "Post Automation") 44 dialog.recess().add(mainFrame) 45 dialog.setButtonVisibile('ok',False) 46 dialog.setButtonVisibile('cancel',False) 47 dialog.show(width=1000, height=100) 48 49 50def postprocAuto(modelPath, resultPath, outDir): 51 52 # Create Session Pointer 53 ses = Session() 54 # New 55 ses.new() 56 57 # Define Capture Image Tool 58 capture = CaptureImageTool() 59 capture.type = 'jpg' 60 capture.width = 1200 61 capture.height = 800 62 63 #Define H3D export 64 exportH3D = ExportModelH3D(animation=True,previewImage=False,compressOutput=True,compressionLoss=0.05) 65 66 # Dictionary with dataType dependent result scalar settings 67 resDict = { 68 'Displacement' : ['Mag','X','Y','Z'], 69 'Composite Stress' : ['vonMises','P1 (major)','P2 (mid)','P3 (minor)'], 70 'Composite Strain' : ['vonMises','XX','YY','ZZ'], 71 'Stress' : ['vonMises','MaxShear','In-plane P1 (major)','In-plane P2 (minor)'] 72 } 73 74 # Dictionary with dataType dependent legend settings (precsion, numerical format, 75 legDict = { 76 'Displacement' : [5,'scientific',2], 77 'Composite Stress' : [6,'engineering',4], 78 'Composite Strain' : [7,'fixed',6], 79 'Stress' : [10,'engineering',2] 80 } 81 # Change window type 82 ses.get(Window).type = 'animation' 83 84 startPageId=ses.get(Page).id+1 85 86 # Loop over data types, 1 page per data type 87 for dType in list(resDict.keys()): 88 ap = Page(title=dType,layout = 9) 89 ses.setActive(Page,page=ap) 90 91 # Loop over data components, one window per component 92 for i, w in enumerate(ses.getWindows()): 93 dComp = resDict.get(dType)[i] 94 ses.setActive(Window,window=w) 95 96 # Load Model 97 w.addModelAndResult(modelPath, result=resultPath) 98 99 # Set scalar results 100 res = ses.get(Result) 101 resScalar = ses.get(ResultDefinitionScalar) 102 resScalar.setAttributes(dataType=dType,dataComponent=dComp) 103 104 # Plot results 105 res.plot(resScalar) 106 107 # Define legend settings 108 leg=ses.get(LegendScalar) 109 leg.setAttributes(numberOfLevels =legDict.get(dType)[0], 110 numericFormat =legDict.get(dType)[1], 111 numericPrecision=legDict.get(dType)[2]) 112 113 # Define ISO settings 114 resIso = ses.get(ResultDefinitionIso) 115 resIso.setAttributes(dataType=dType,dataComponent=dComp) 116 dispIso = ses.get(ResultDisplayIso) 117 res.plotIso(resIso) 118 119 # Set ISO value dependent on min/max 120 dispIso.value=leg.minValue+(leg.maxValue-leg.minValue)/5 121 122 # Set animation frame 1 123 animTool=AnimationTool() 124 animTool.currentFrame=1 125 126 # Capture jpg 127 jpgPath = os.path.join(outDir,dType+' - '+dComp+'_iso_view.jpg') 128 capture.file = jpgPath 129 capture.capture() 130 131 # Capture H3D 132 h3dPath = os.path.join(outDir,dType+' - '+dComp+'.h3d') 133 exportH3D.setAttributes(file=h3dPath,window=w) 134 exportH3D.export() 135 136 # Use Model, Collection and Part class to isolate component 137 if True: 138 mod=ses.get(Model) 139 col=Collection(Part) 140 mod.hide(col) 141 mod.get(Part,172).visibility=True 142 # Use evalHWC isolate component for export 143 else: 144 evalHWC('hide component all') 145 evalHWC('show component 172') 146 147 # Set Views and export 148 evalHWC('view orientation left') 149 jpgPath = os.path.join(outDir,dType+' - '+dComp+'_left_view.jpg') 150 capture.file = jpgPath 151 evalHWC('show component all') 152 evalHWC('view orientation iso') 153 154 ses.setActive(Page,id=startPageId) 155 156if __name__ == "__main__": 157 MyCustomGui()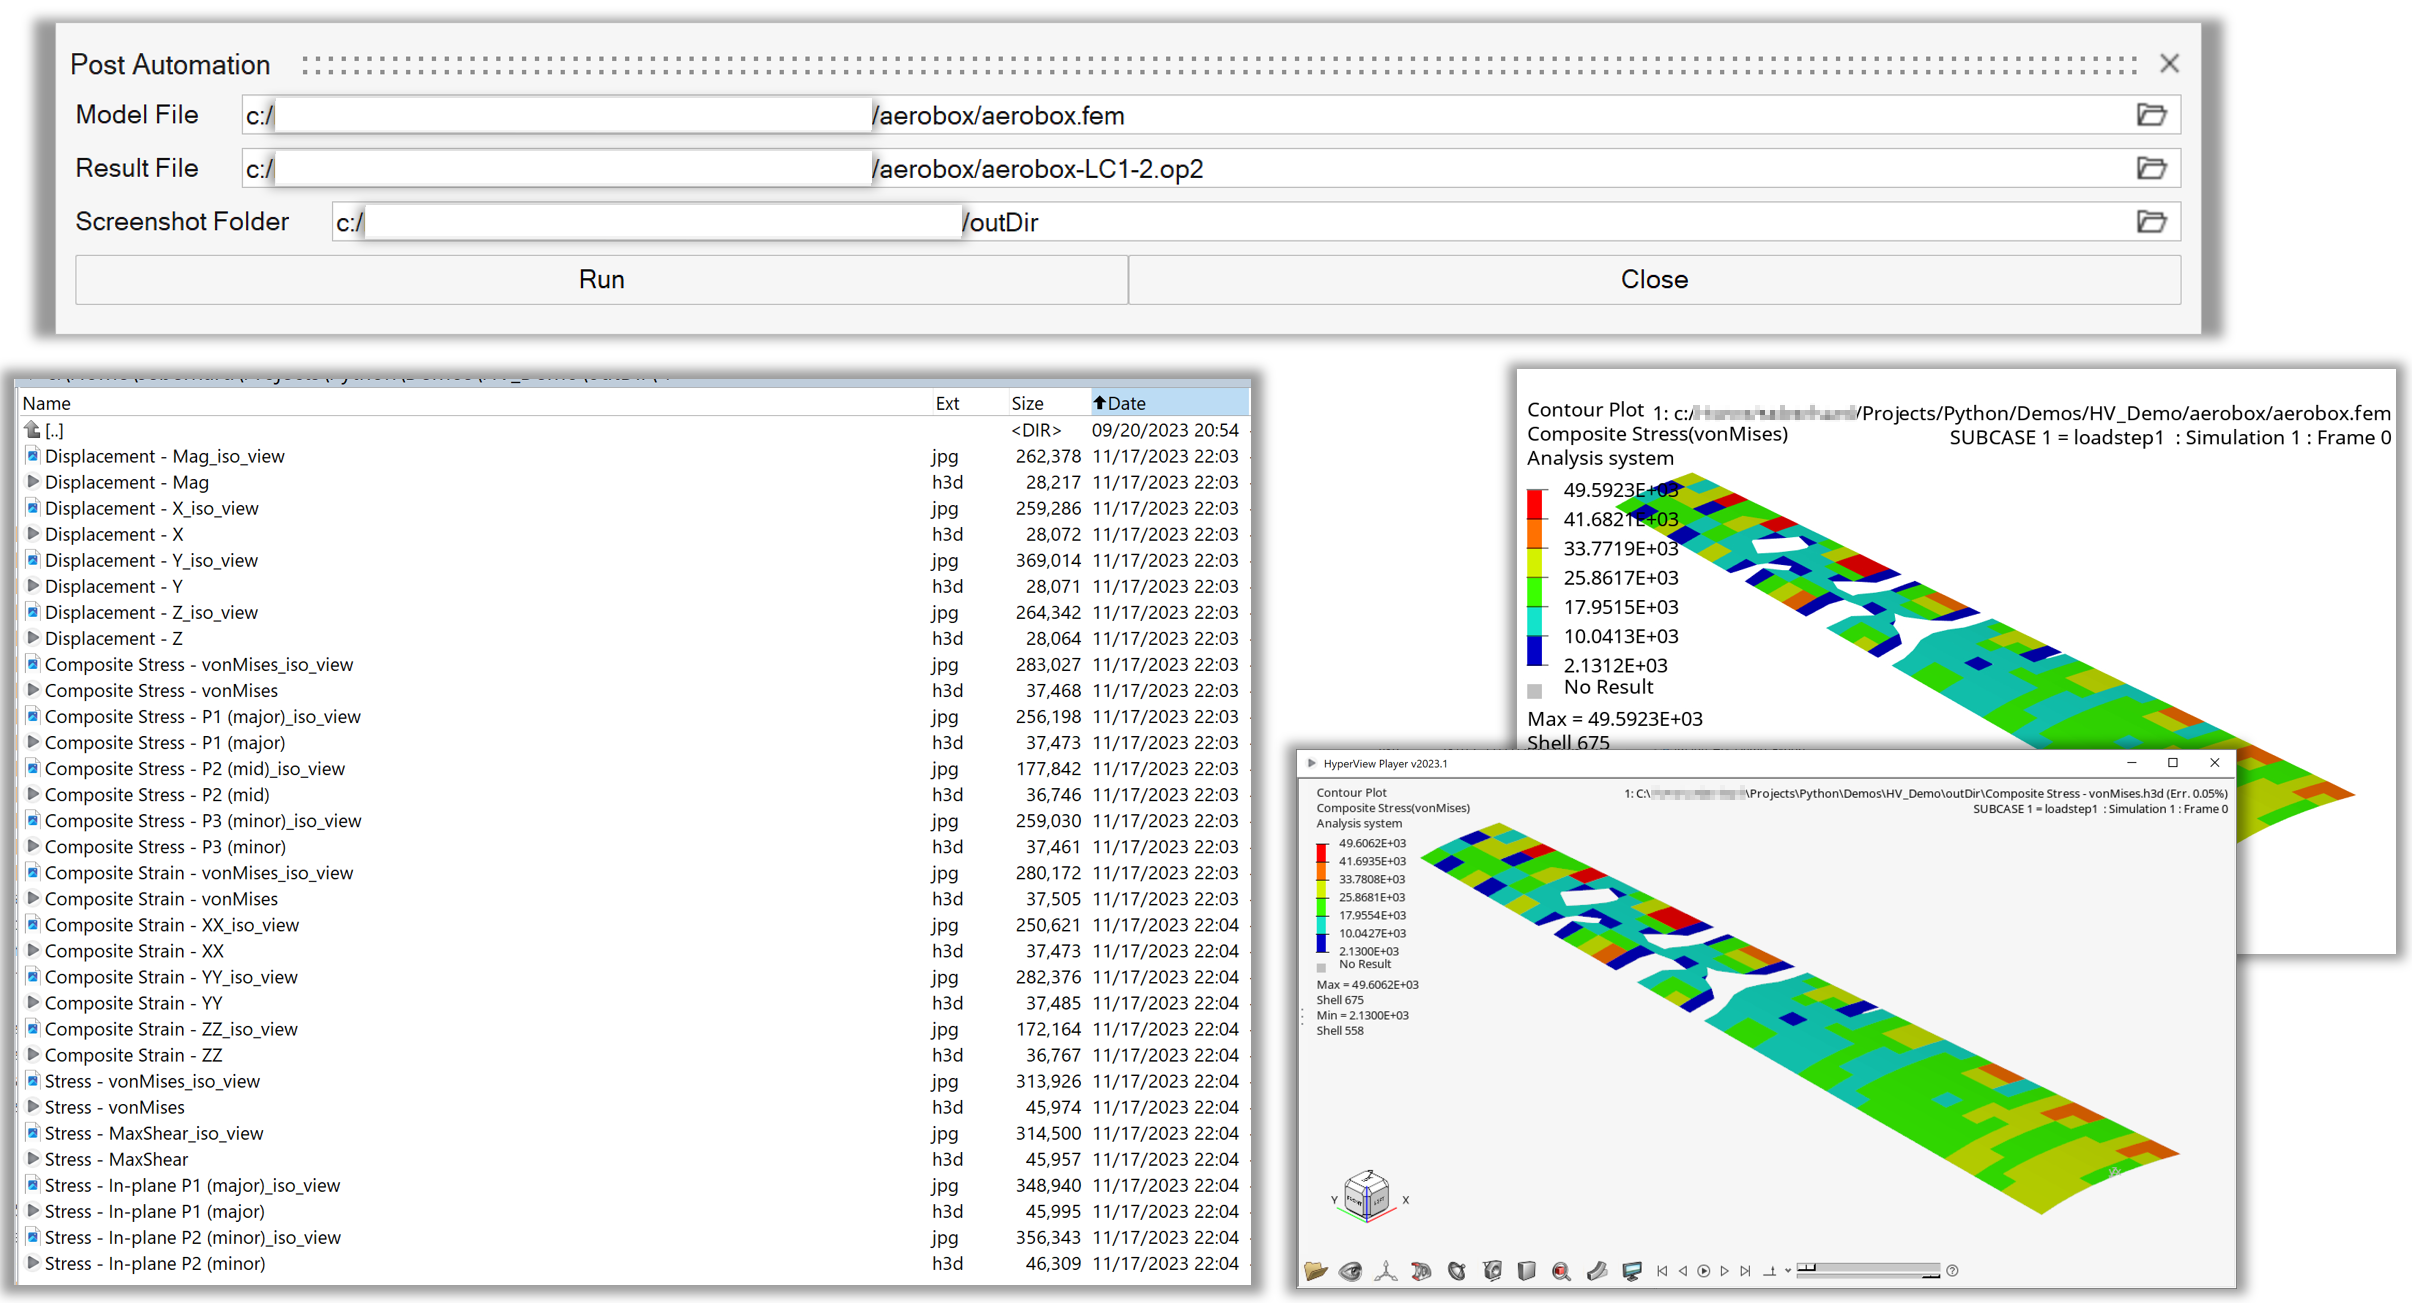
Figure 3. Start GUI and exported images / H3D’s of ‘Macro wiht GUI’
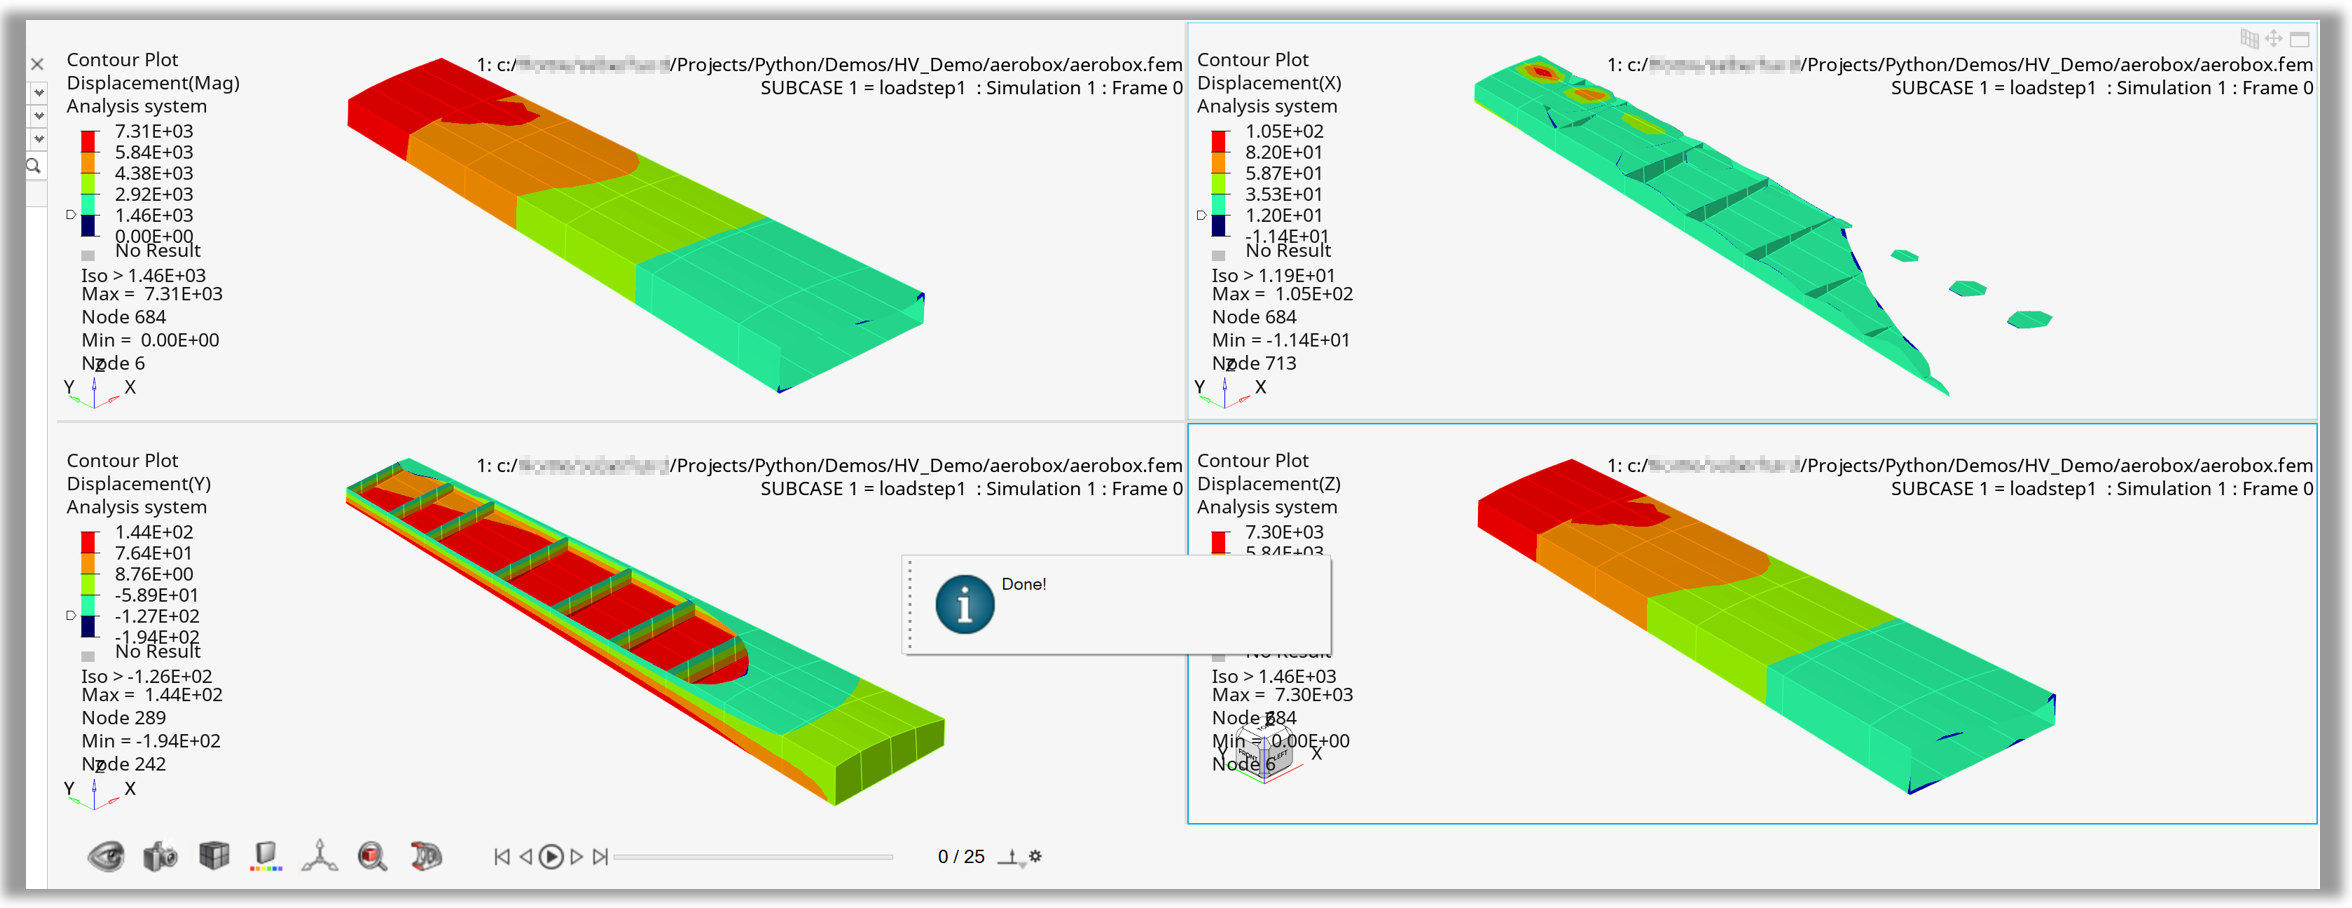
Figure 4. Page created for one data type by ‘Macro wiht GUI’
Example 04 - Contour Maximum by Sphere#
Contour max sphere by colletion with filters, modify legend#1from hw import * 2from hw.hv import * 3import os 4 5scriptDir = os.path.abspath(os.path.dirname(__file__)) 6modelFile = os.path.join(scriptDir,'aerobox','aerobox.fem') 7resultFile = os.path.join(scriptDir,'aerobox','aerobox-LC1-2.op2') 8 9hotspotRadius = 400 10 11# Load Model 12ses = Session() 13ses.new() 14page=ses.get(Page) 15win=ses.get(Window) 16win.type = 'animation' 17win.addModelAndResult(modelFile, result=resultFile) 18 19# Contour scalar 20res = ses.get(Result) 21resScalar = ses.get(ResultDefinitionScalar) 22resScalar.setAttributes(dataType='Composite Stress',dataComponent='vonMises',layer='Max') 23res.plot(resScalar) 24 25# Create Collection via TopN filter 26maxElemCol=Collection(Element,populate=False) 27elemFilter=FilterByScalar(operator='topN',value=1) 28maxElemCol.addByFilter(elemFilter) 29 30# Get centroid of element with maximum scalar value 31maxElem=maxElemCol.getEntities()[0] 32centroid=maxElem.centroid 33 34# Create collection with given radius 35sphereCol=Collection(Element,populate=False) 36sphereFilter=FilterBySphere(x=centroid[0], 37 y=centroid[1], 38 z=centroid[2], 39 radius=hotspotRadius) 40sphereCol.addByFilter(sphereFilter) 41 42# Define font 43headFont=Font(size=14,style='bold') 44 45# Modify legend 46legend=ses.get(LegendScalar) 47legend.setAttributes(headerText='Hostpot Radius = '+str(hotspotRadius), 48 headerVisible=True, 49 headerFont=headFont, 50 numberOfLevels=8, 51 numericFormat='fixed', 52 numericPrecision=0) 53 54# Contour only sphere collection 55resScalar.collection=sphereCol 56res.plot(resScalar) 57 58# Attach max note with evalHWC 59maxId = str(maxElem.id) 60maxLabel = 'Max Element '+maxId 61evalHWC('annotation note create "'+maxLabel+'"') 62evalHWC('annotation note "'+maxLabel+'" attach entity element '+maxId) 63evalHWC('annotation note "'+maxLabel+'" \ 64 display text= "Max Element: {entity.id}\\nMax Value: {entity.contour_val}" \ 65 movetoentity=true \ 66 filltransparency=false \ 67 fillcolor="255 255 255"') 68 69# Set frame with AnimationTool() 70animTool=AnimationTool() 71animTool.currentFrame=1 72 73# Modify view with evalHWC 74evalHWC('view orientation iso')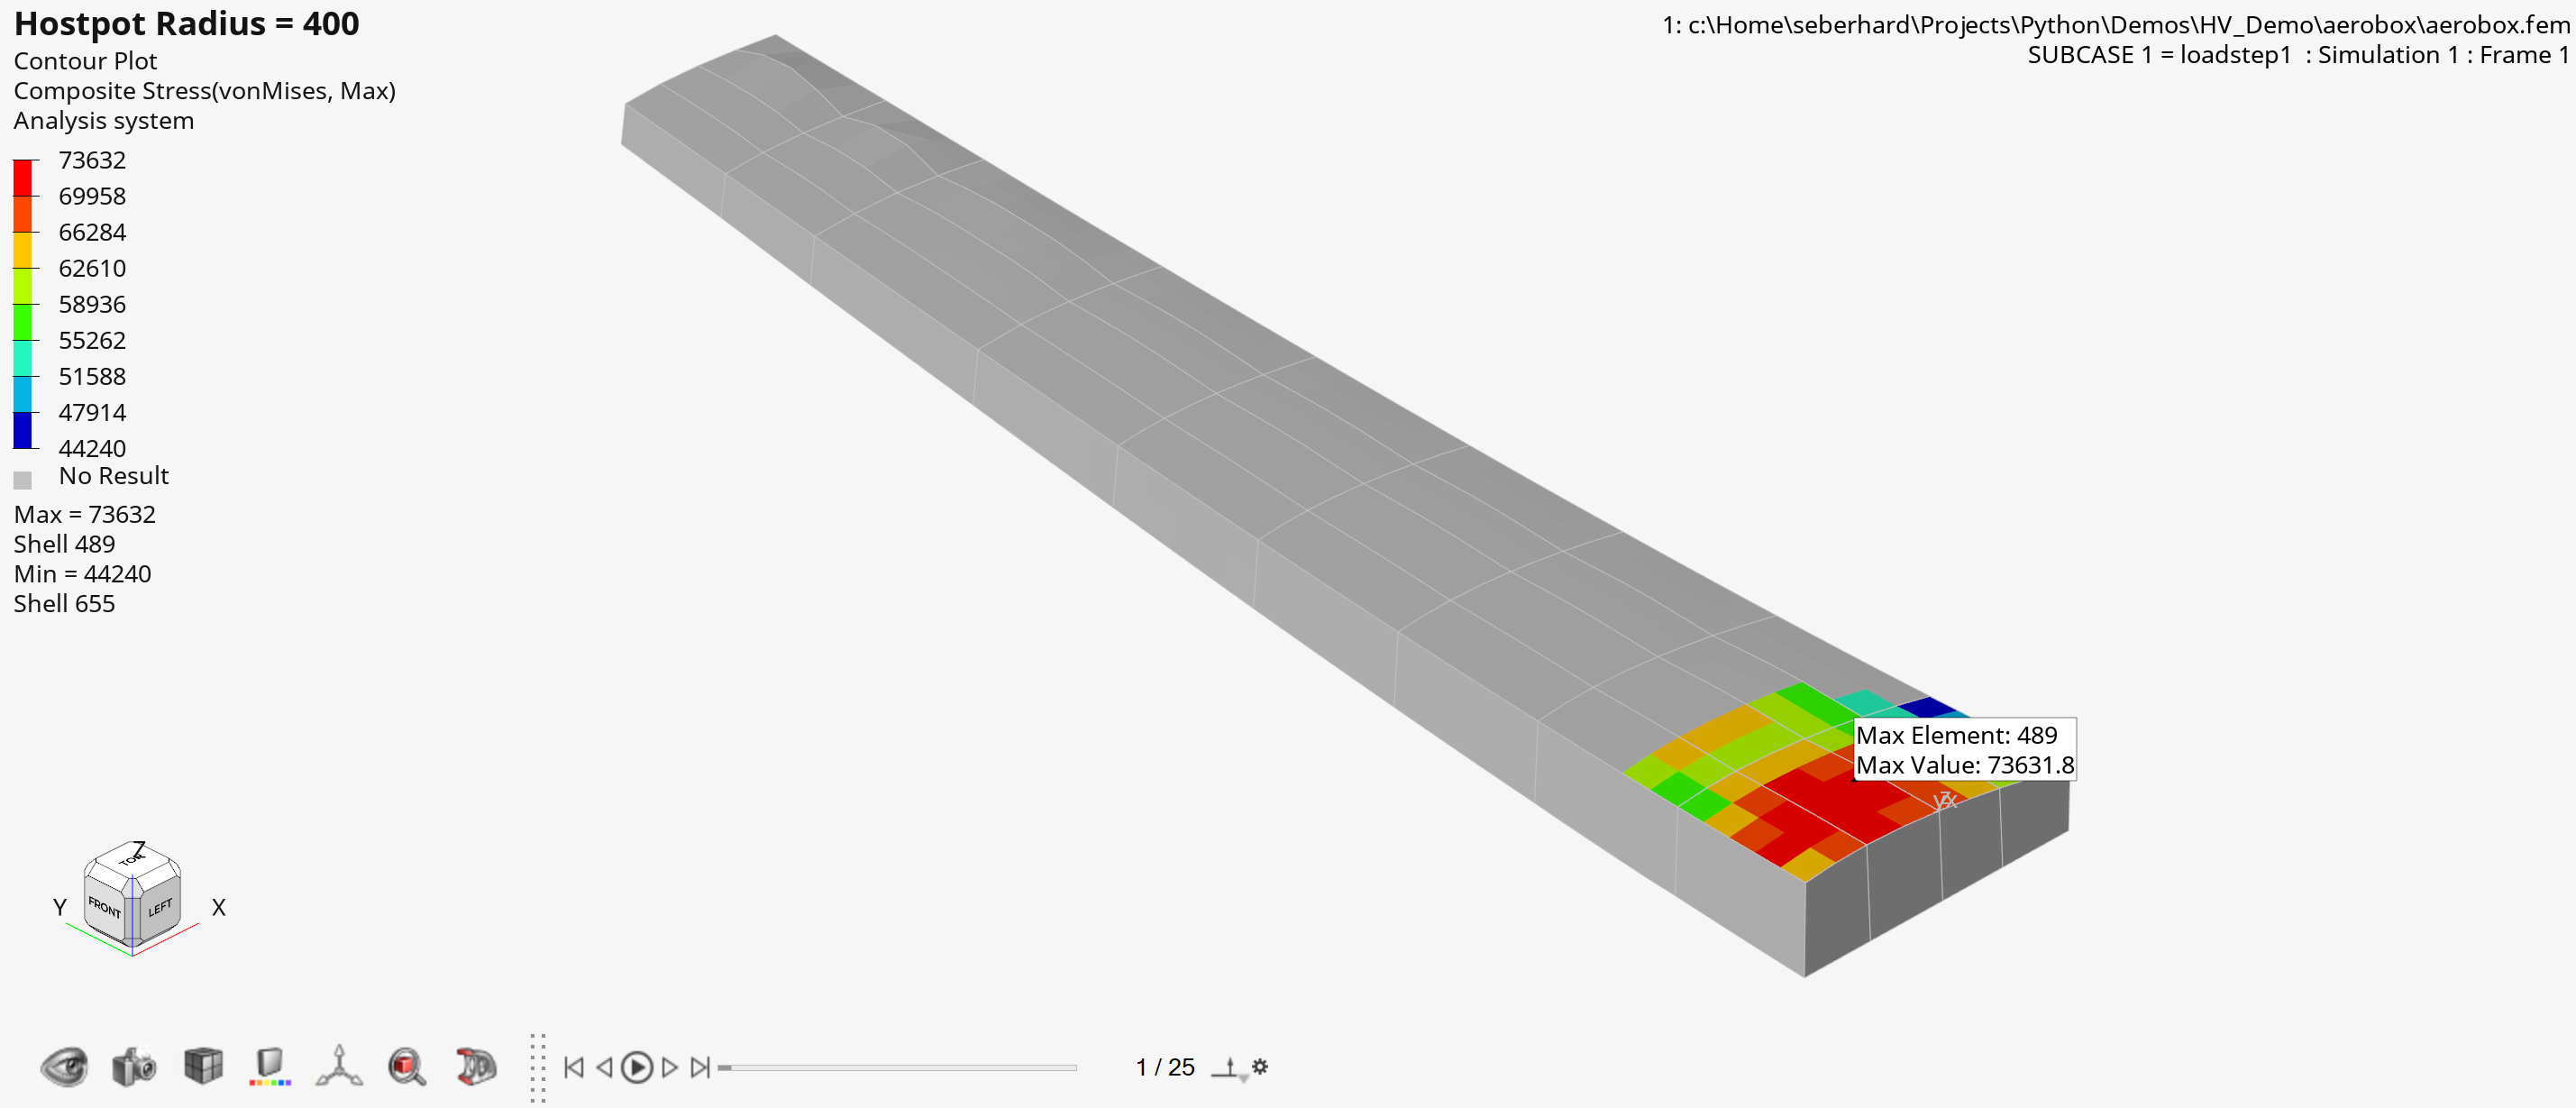
Figure 5. Output of ‘Contour Maximum by Sphere
HyperGraph Examples#
Example 01 - Curves from Expression#
Create two curves from math expressions#1from hw import * 2from hw.hg import * 3import os 4 5ALTAIR_HOME = os.path.abspath(os.environ['ALTAIR_HOME']) 6plotFile = os.path.join(ALTAIR_HOME,'demos','mv_hv_hg','plotting','madymo','ANGACC') 7 8ses = Session() 9ses.new() 10win=ses.get(Window) 11win.type = 'xy' 12 13exprXlist = ['0:1:0.0001','c1.x'] 14exprYlist = ['sin(x*2*PI)','c1.y+0.2*sin(60*x*2*PI)'] 15labelList = ['Basic Oscilation 1 HZ','Overtone 60 HZ'] 16 17for exprX,exprY,label in zip(exprXlist,exprYlist,labelList): 18 cu=CurveXY( xFile=plotFile, 19 xSource='math', 20 xExpression= exprX, 21 ySource='math', 22 yExpression= exprY, 23 label=label) 24 25win.update()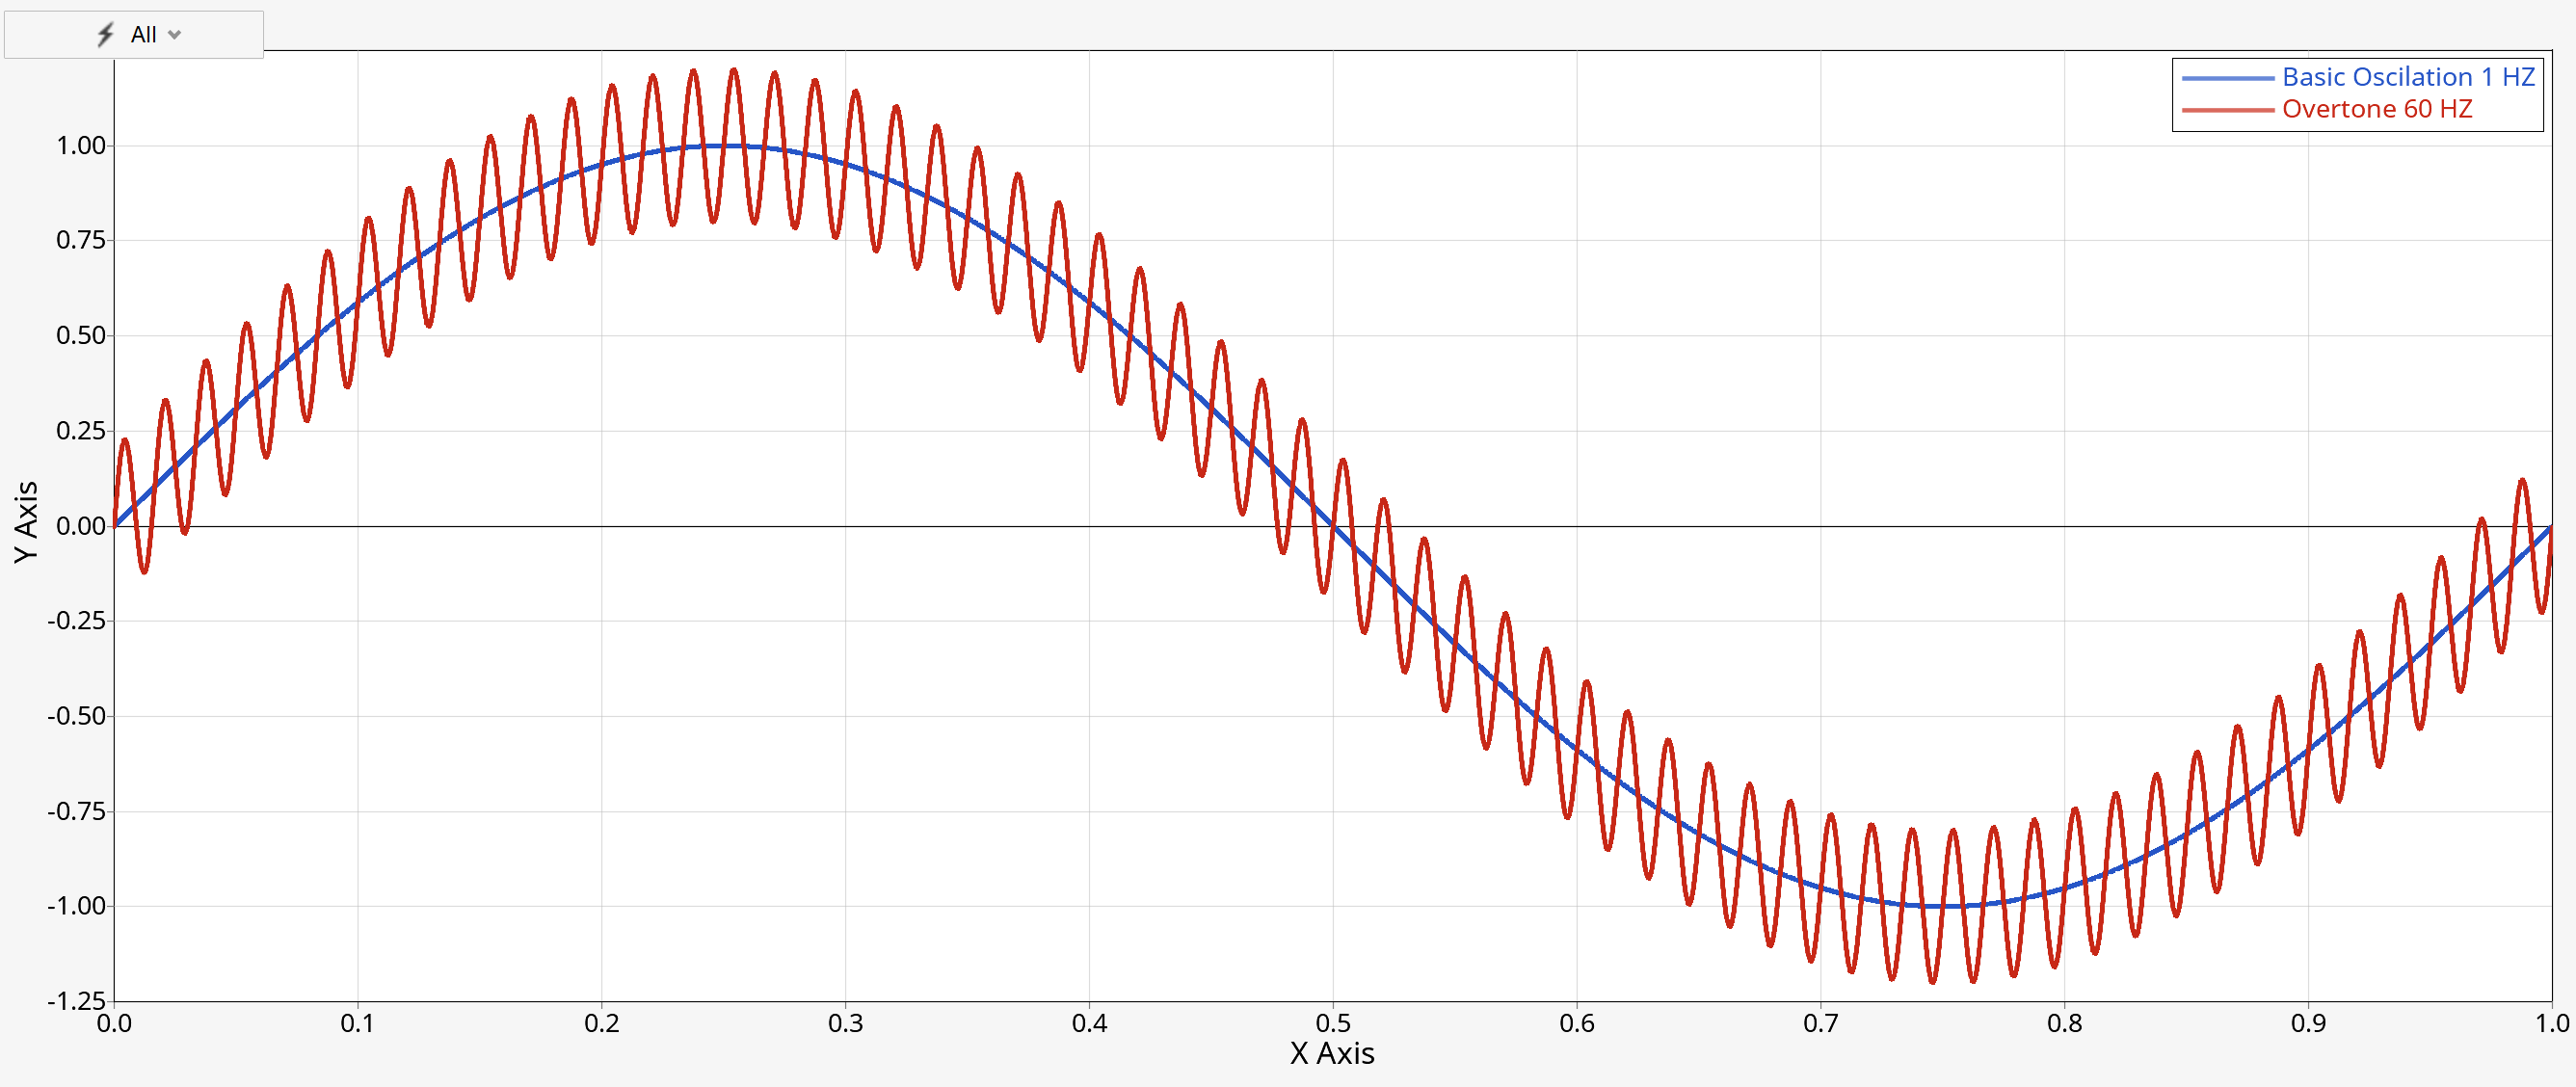
Figure 6. Output of ‘Create two curves from math expressions’
Example 02 - Curves from File#
Load two curves from file, define color and label#1from hw import * 2from hw.hg import * 3import os 4 5ALTAIR_HOME = os.path.abspath(os.environ['ALTAIR_HOME']) 6plotFile = os.path.join(ALTAIR_HOME,'demos','mv_hv_hg','plotting','madymo','ANGACC') 7 8ses = Session() 9ses.new() 10win=ses.get(Window) 11win.type = 'xy' 12 13requestList = ['50th% Hybrid3 - LOWER TORSO','50th% Hybrid3 - UPPER TORSO'] 14colorList=[(255,0,0),(0,0,255)] 15 16for color,request in zip(colorList,requestList): 17 cu=CurveXY( xFile=plotFile, 18 xSource='file', 19 xDataType= 'Time', 20 xRequest= 'Time', 21 xComponent= 'Time', 22 yFile=plotFile, 23 ySource='file', 24 yDataType= 'Angular Acceleration', 25 yRequest= request, 26 yComponent= 'Res. ang. acc.', 27 lineColor=color, 28 label='{y.HWRequest} - {y.HWComponent}') 29 30win.update()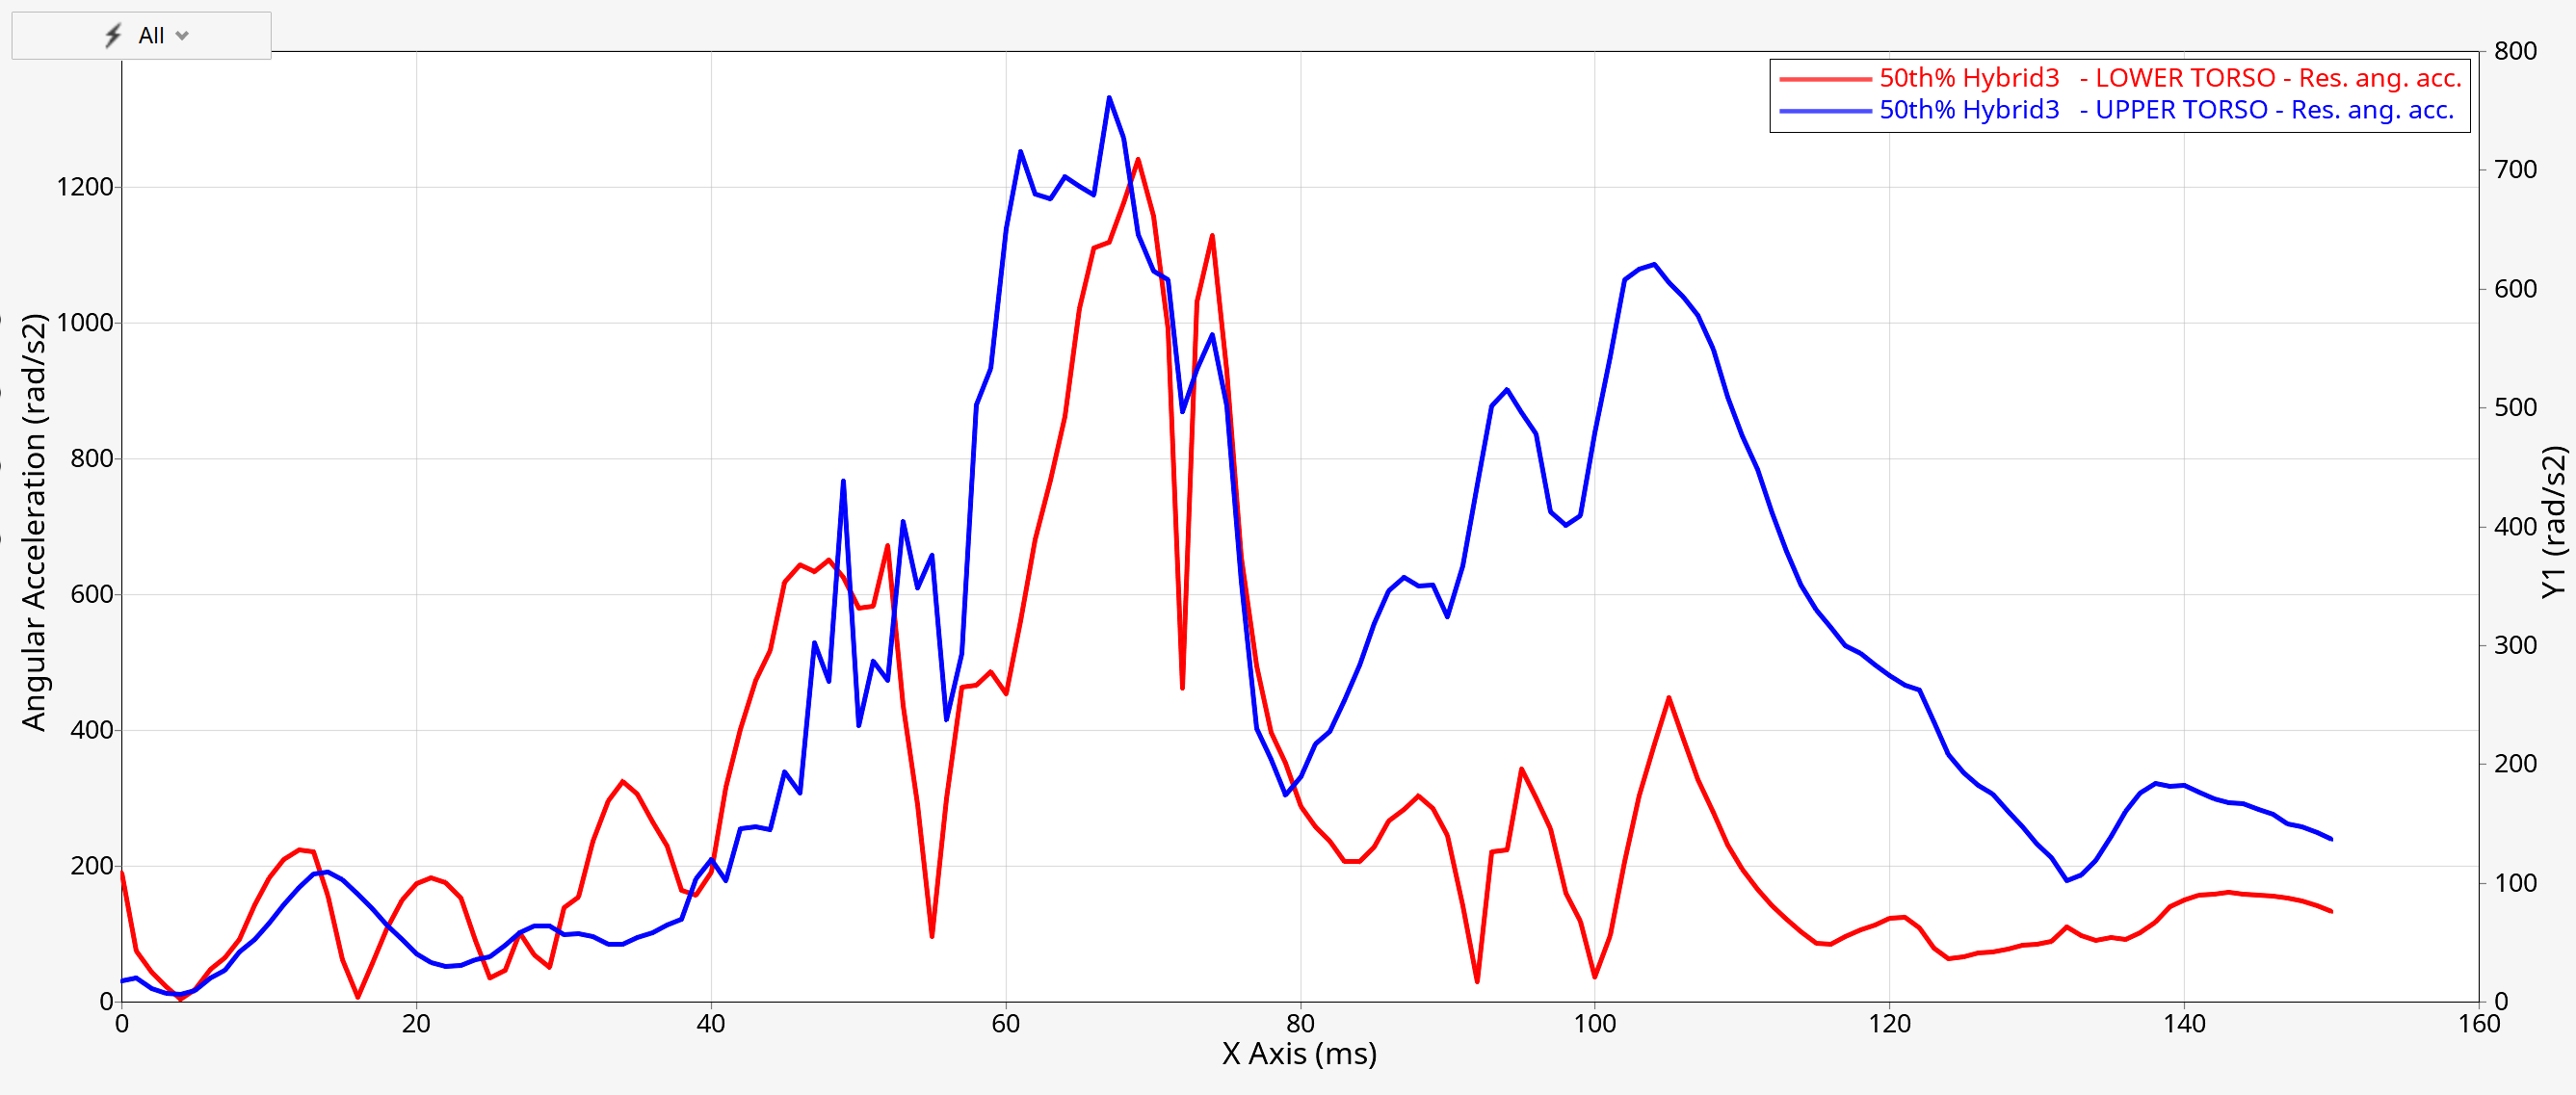
Figure 7. Output of ‘Load two curves from file, define color and label’
Example 03 - Curves from Files, Datums, Notes, Legends and PNG, XYDATA Export#
Load two curves, shade the area between, add notes and datums and export PNG#1from hw import * 2from hw.hg import * 3import os 4 5ALTAIR_HOME = os.path.abspath(os.environ['ALTAIR_HOME']) 6plotFile = os.path.join(ALTAIR_HOME,'demos','mv_hv_hg','plotting','madymo','ANGACC') 7jpgFile = os.path.join(os.path.abspath(os.path.dirname(__file__)) ,'HG_Image_Export.png') 8xyDataFile = os.path.join(os.path.abspath(os.path.dirname(__file__)) ,'HG_Curve_Export.xydata') 9 10# New session 11ses = Session() 12ses.new() 13win=ses.get(Window) 14win.type = 'plot' 15 16# Define image and curve export tools 17captureImage = CaptureImageTool(file=jpgFile,type = 'png',width = 2000,height = 1000,) 18exportCurves = ExportCurves(file=xyDataFile,format='xyData',range='all') 19 20# Layout and channel settings 21colorList = [(255,0,0),(0,0,255)] 22requestList = ['50th% Hybrid3 - LOWER TORSO','50th% Hybrid3 - UPPER TORSO'] 23autoPosList = ['right','left'] 24 25# Loop over curves, notes and datums 26for color,request,autoPos in zip(colorList,requestList,autoPosList): 27 28 # Add curves 29 cu=CurveXY( xFile=plotFile, 30 xSource='file', 31 xDataType= 'Time', 32 xRequest= 'Time', 33 xComponent= 'Time', 34 yFile=plotFile, 35 ySource='file', 36 yDataType= 'Angular Acceleration', 37 yRequest= request, 38 yComponent= 'Res. ang. acc.', 39 lineColor=color, 40 label='{y.HWRequest} - {y.HWComponent}') 41 42 # Add curve math 43 cu.mathAdd('SAE', padding=1, direction=1, filterClass=15) 44 cu.mathAdd('trim',start=20,end=130) 45 46 cuId = str(cu.id) 47 48 # Add note attached to curve math 49 no = Note(attachTo='curve', 50 attachmentCurve=cu.id, 51 attachmentPoint='indexofmax(c'+cuId+'.y)', 52 text='Max = {y} at {x}', 53 autoPosition=True, 54 autoPositionStrategy=autoPos, 55 curveColor=True) 56 57 # Add vertical datum 58 dv=DatumVertical(position='c'+cuId+'.x[indexofmax(c'+cuId+'.y)]', 59 label='Max '+cu.yRequest, 60 labelLocation='upperCenter', 61 lineColor=color) 62 63# Modify legend 64legend = ses.get(Legend) 65legFont = Font(size = 14) 66legend.placement = 'insideRightBottomCorner' 67legend.font = legFont 68 69# Shade area between 2 curves 70cu.setAttributes(shadeArea= True, 71 shadeStyle= 'betweenCurves', 72 shadeSecondCurve= 1, 73 shadeColor= 'Blue', 74 shadeAlpha= 0.2) 75 76win.update() 77 78# Eport image and modified curve values in XYDATA format 79captureImage.capture() 80exportCurves.export()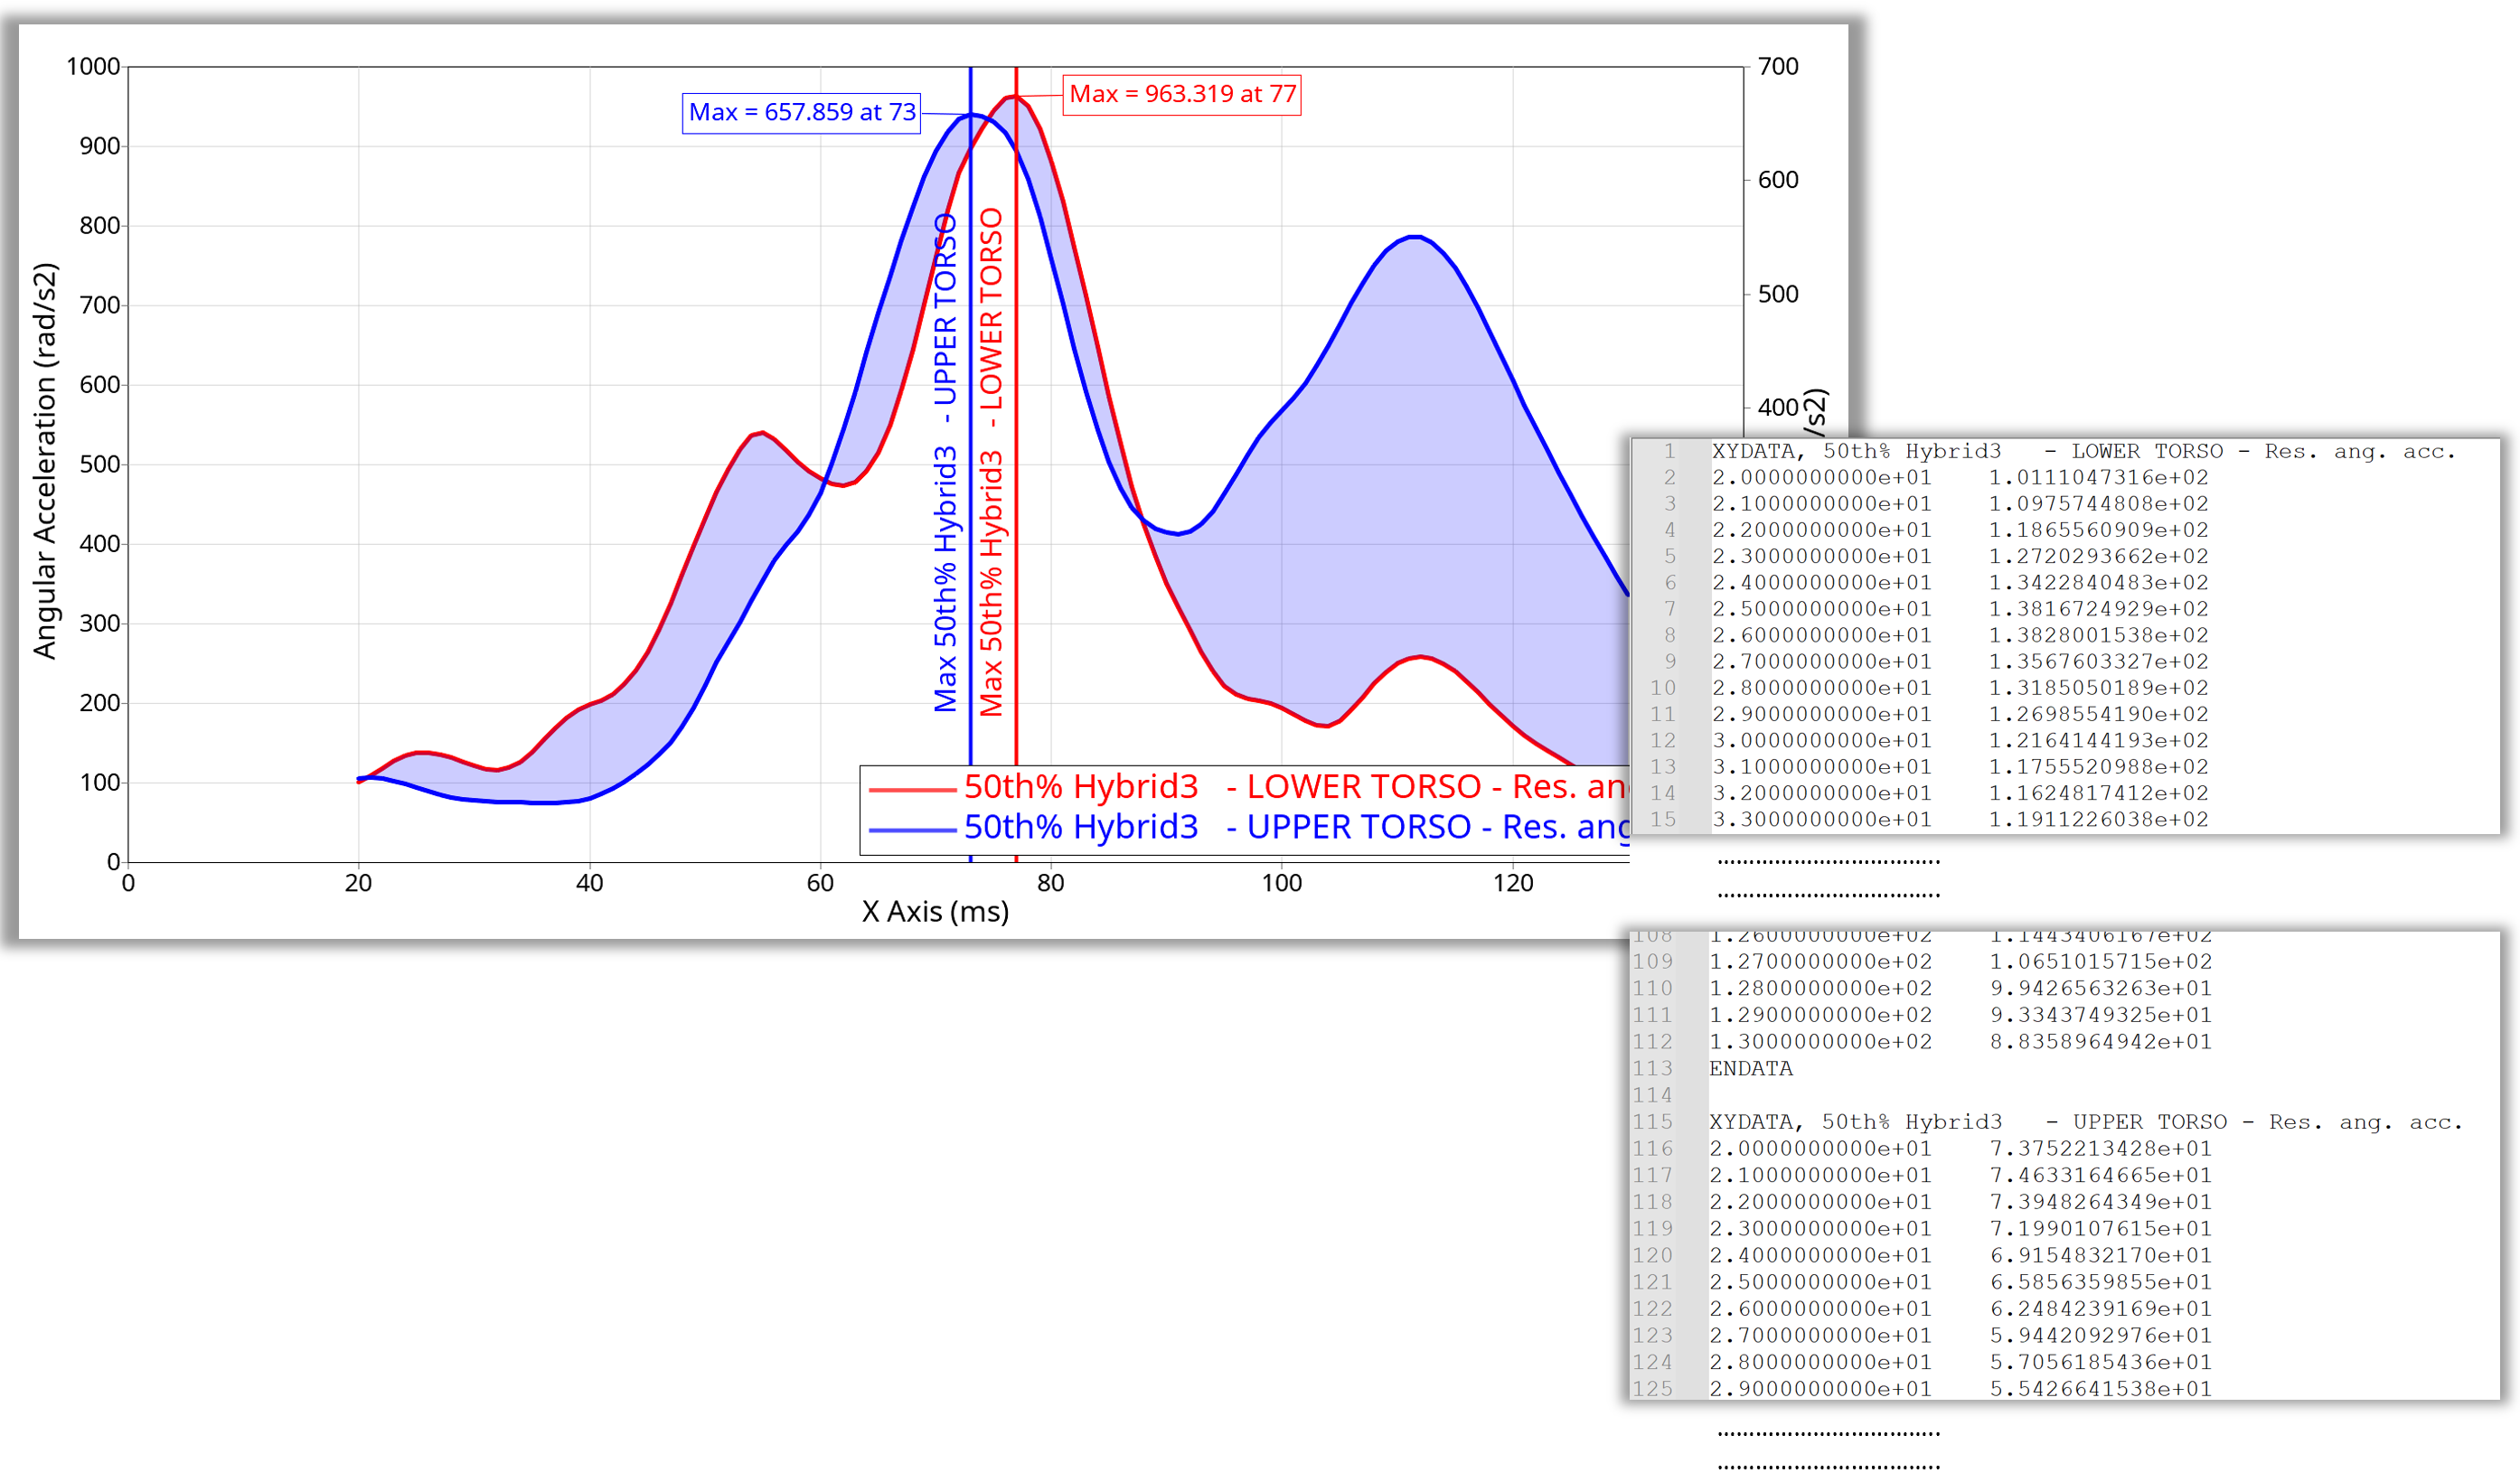
Figure 8. Exported Image of script ‘Curves from Files, Datums, Notes, Legends and PNG, XYDATA Export’
Example 04 - evalHWC() for Curve Import and Math Operations#
evalHWC() - Curve Import and Math Operations#1from hw import * 2from hw.hg import * 3import os 4 5src_path = os.path.dirname(os.path.abspath(__file__)) 6plotFile = os.path.join(src_path,'ANGACC') 7 8# New session 9evalHWC('delete session') 10# Set Client Type to HyperGraph 11evalHWC('hwd window type=\"HyperGraph 2D\"') 12# Load curves with build plots module 13evalHWC('xy option layout destination=oneplotperrequest') 14evalHWC('xy option layout layout=1') 15evalHWC('xy load file='+plotFile+' ydatatype= \"Angular Acceleration\" \ 16 yrequest= \"50th% Hybrid3 - LOWER TORSO\" , \"50th% Hybrid3 - UPPER TORSO\" ycomponent= all') 17evalHWC('xy curve stackadd range="w:all i:all" operation=trim start=20 end=130 interpolate=false') 18# Add curve math for all curves in current plot 19evalHWC('xy curve stackadd range="w:all i:all" operation=SAE padding=1 samples=10 direction=3 filterClass=60') 20evalHWC('xy curve stackadd range="w:all i:all" operation=resample type="Resample Fixed Points" fixnum=100.0')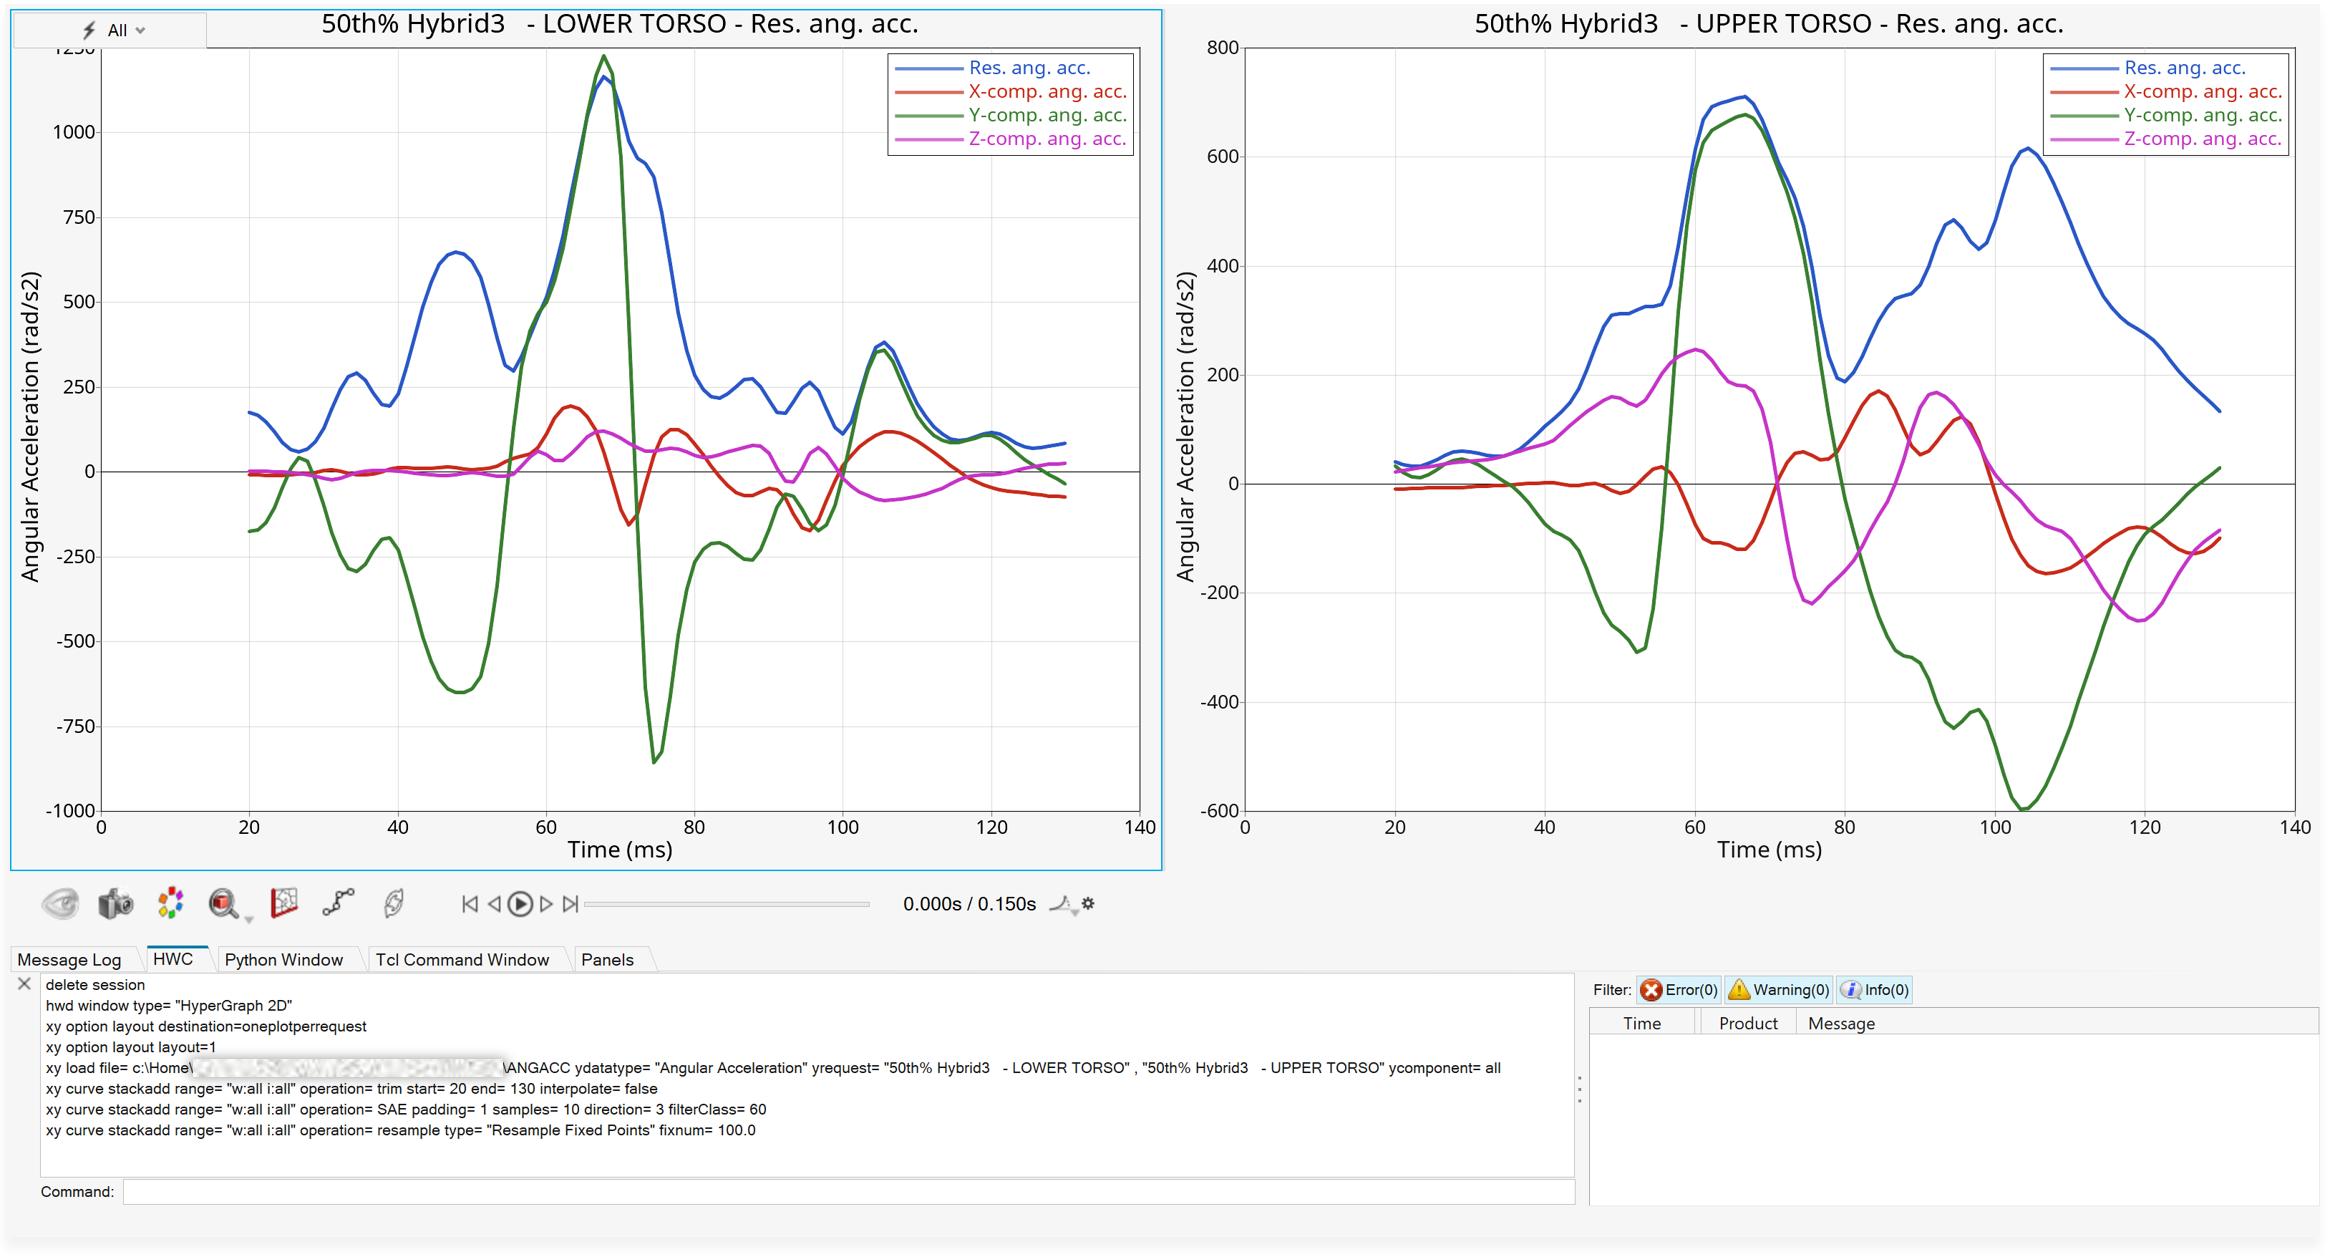
Figure 9. Output of ‘evalHWC() for Curve Import and Math Operations’
Example 05 - Create Multiple Plot Layout#
Create multiple pages from channel info stored in dictionary#1from hw import * 2from hw.hg import * 3import os 4import itertools 5 6ALTAIR_HOME = os.path.abspath(os.environ['ALTAIR_HOME']) 7plotFile = os.path.join(ALTAIR_HOME,'demos','mv_hv_hg','plotting','madymo','ANGACC') 8 9# New Session 10ses = Session() 11ses.new() 12 13# Dictionary with curve channel names 14plotDict = { 15 'yRequests' : ['50th% Hybrid3 - LOWER TORSO','50th% Hybrid3 - UPPER TORSO', '50th% Hybrid3 - UPPER LEG RIGHT', '50th% Hybrid3 - UPPER LEG LEFT'], 16 'yComponents' : ['Res. ang. acc.', 'X-comp. ang. acc.', 'Y-comp. ang. acc.', 'Z-comp. ang. acc.'], 17 'lineColors' : ['#ff0000', '#00ff00', (0,0,255), (0,0,0)], 18 } 19 20# Create fonts and colors 21fontAxisText = Font(family='Arial',style='regular',size=14) 22legendBorderColor = Color(rgb=(204, 204, 204)) 23datumColor = Color(hex='#ff0000') 24 25# Loop over pages 26for index in range(1,3): 27 ap =ses.get(Page) 28 if index > 1: 29 ap=Page() 30 ses.setActive(Page,id =index) 31 32 # Define page attributes 33 ap.setAttributes(layout=9, title='HG Demo ' + str(index)) 34 i=0 35 36 # One plot per request 37 for request in plotDict.get('yRequests'): 38 i += 1 39 aw=ses.setActive(Window,window=i) 40 aw.type='xy' 41 42 # Add curves from dictionary 43 for (component,color) in zip(plotDict.get('yComponents'),plotDict.get('lineColors')): 44 cu=CurveXY( 45 xFile=plotFile, 46 xType='file', 47 xDataType= 'Time', 48 xRequest= 'Time', 49 xComponent= 'Time', 50 yFile=plotFile, 51 yType='file', 52 yDataType= 'Angular Acceleration', 53 yRequest= request, 54 yComponent= component, 55 lineColor=color, 56 label='{y.HWRequest} - {y.HWComponent}') 57 58 # Add curve math SAE filter 59 cu.mathAdd('SAE', padding=1, direction=1, filterClass=15) 60 61 # Create and Modify curve math trim operatation 62 mathTrim=cu.mathAdd('trim') 63 mathTrim.setAttributes(start=20,end=140) 64 65 # Add vertical datum line at curve max 66 dv=DatumVertical( position='c1.x[indexofmax(c1.y)]', 67 label='Y Max', 68 labelLocation='upperCenter', 69 lineColor = datumColor) 70 71 # Edit vertical axis label using font object 72 av=ses.get(AxisVertical,curve=cu) 73 av.text= 'Max of Resultant = {max(c1.y)}' 74 av.font=fontAxisText 75 76 77 # Modify Header values 78 header=ses.get(Header) 79 header.setAttributes( visibility=True,text='Demo Window '+str(i)) 80 81 # Modify Legend Style 82 83 legend=ses.get(Legend) 84 legend.setAttributes(borderColor=legendBorderColor, 85 borderStyle=3, 86 placement='insideRightBottomCorner') 87 88 # Create note at maximum of curve 3 89 note = Note( attachTo='curve', 90 attachementCurve=1, 91 attachmentPoint='indexofmax(c1.y)', 92 text='Max = {y} @ {x}', 93 autoPosition=True, 94 autoPositionStrategy='right', 95 curveColor=True) 96 97 # Update() recalculates, fits and draws 98 aw.update()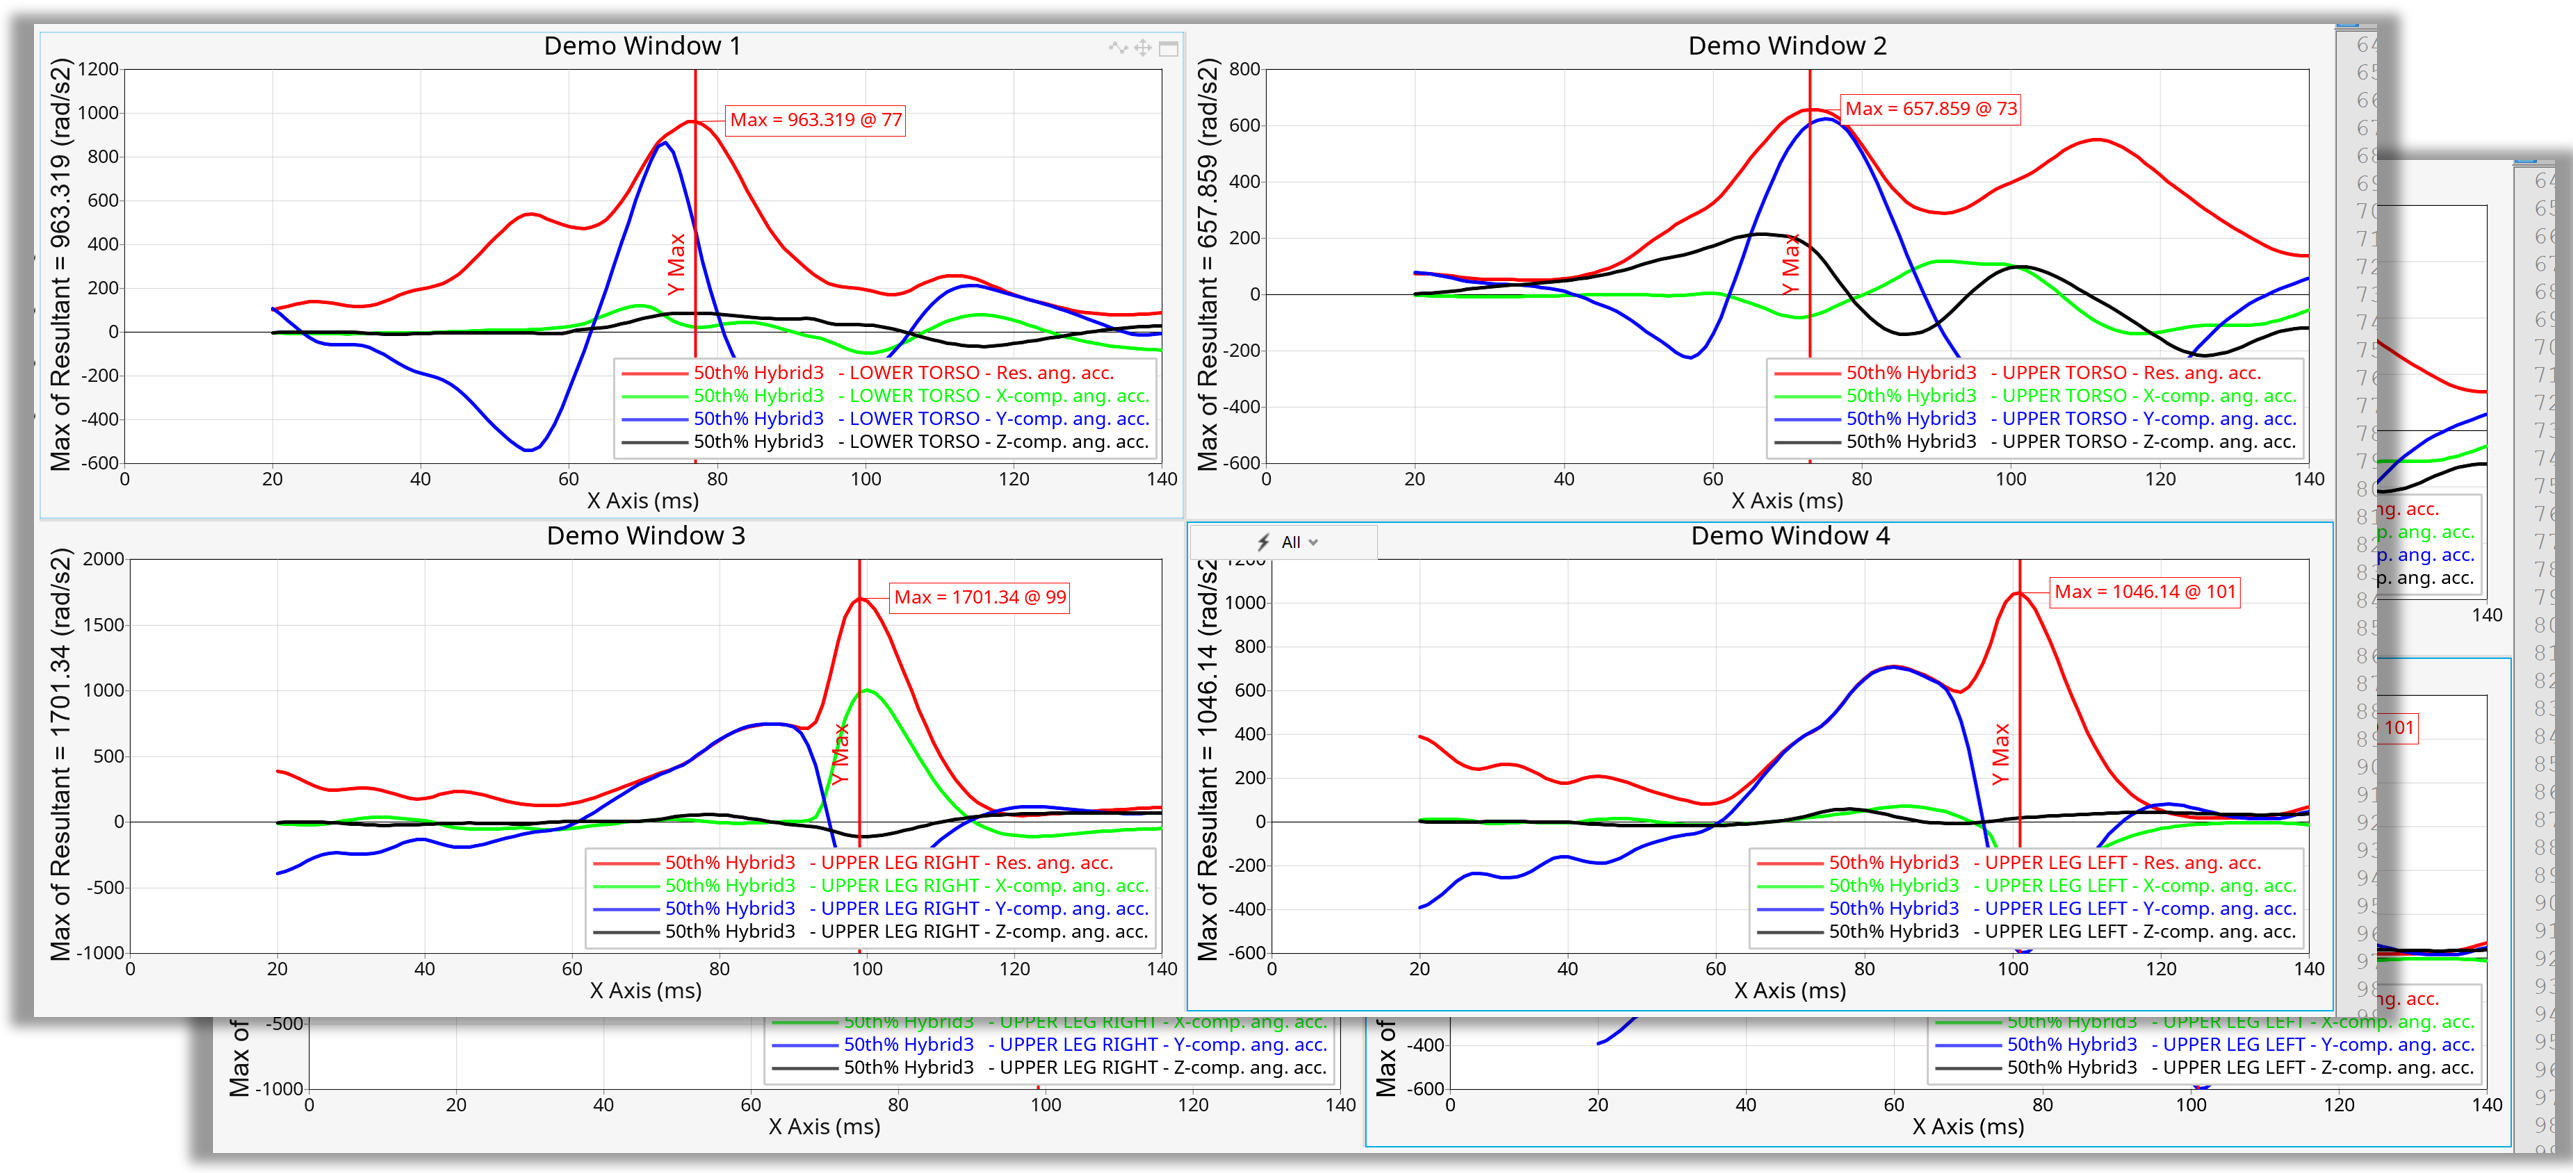
Figure 10. Output of ‘Create Multiple Plot Layout’