3D curve: environment and functionalities
Introduction
A 3D curve has two graphic representation environments :
- Representation on a 3D graph (by default) that permits to have a global view of the 3D curve appearance.
- Representation on a 2D graph that permits to have a more accurate representation of the 3D curve appearance for a more refined analysis of the values.
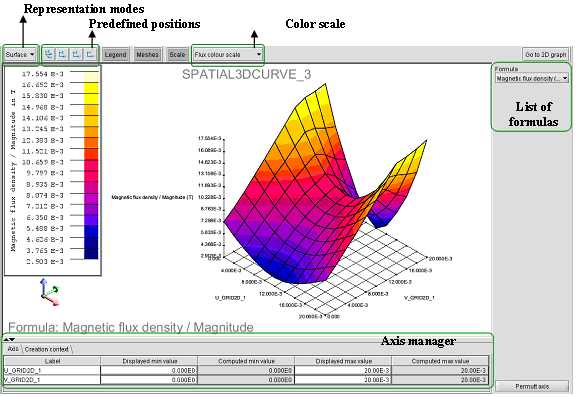
3D graph: environment
The 3D graph representation that permits to visualize the curve in three dimensions is presented below.
| Element | Function |
|---|---|
| Legend button | Permits to hide/display the legend (the scale of color gradation) |
| Meshes button | Permits to hide/display the meshes of the curve |
| Scale button | Permits to hide/display the gradings on the axes |
| Go to 2D graph button | Permits to pass to the representation on a 2D graph of the 3D curve |
| Switch axis | Permits to switch the two axes in abscissas |
| List of formulas | Permits to display another quantity, if the 3D curve comprises several quantities |
| Representation modes | Permits to choose the mode of graphic representation of the 3D curve (surface, sticks, wall, …) |
| Predefined positions | Permits to position the curve depending on predefined views (plan XY, plan XZ, plan YZ,…) |
| Color scale | Permits to change the colors of the gradation |
| Axis manager | Permits to modify the minimal and maximal limits of each of the axes in abscissa. |
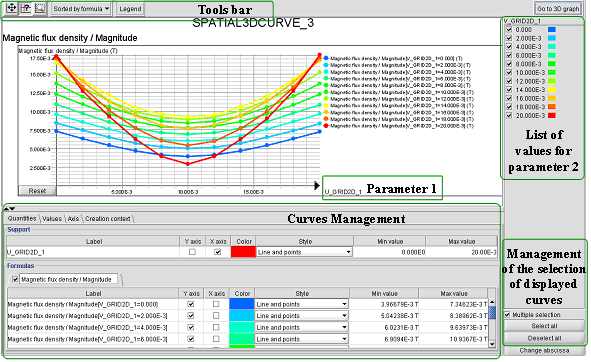
2D graph: environment
The representation on a 2D graph of a 3D curve has an environment based on the same environment of the 2D curves.
Nevertheless, there are the own functions of this 2D graph environment of a 3D curve. They are presented and described below.
| Element | Function |
|---|---|
| Tools bar | Similar to the 2D curve environment |
| Curves management | Similar to the 2D curve environment |
| Management of the selection of displayed curves |
Permits to choose between two modes of selection:
Note : in multiple selection, there are two buttons permitting to select/deselect all the values of the parameter 2 |
| List of values of 2nd parameter |
Permits to:
|
| Go to 3D graph button | Permits to pass to the representation of the 3D curve on a 3D graph |
| Change abscissa button |
Permits to change the parameter in abscissa Parameter 2 passes in abscissa and the values of parameter 1 are listed in the right window, which permits to display one or more curves in function of the parameter 2 for one or more values of the parameter 1 |