Quantity computation on points: table of results
Table of results
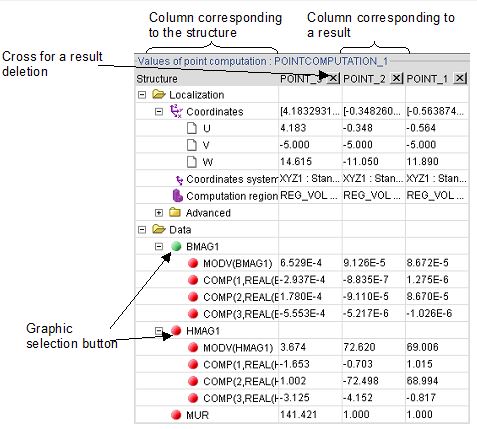
The numerical results of the computation session are displayed in a table.
Table of results: overview
| Element | Function |
|---|---|
| Column corresponding to the structure | The structure of computation point is displayed in the tabulated tree, which one can unfold according to the desired level of information. |
| Column corresponding to a result | point computation is evaluated for each point and a table of result is displayed. |
| Graphic selection button | The user activates the quantity, which is represented graphically while clicking on the red button. The green button marks the graphically displayed quantity. |
| Cross to delete a result | A result can be removed while clicking on the cross. |
Results
Information according to the type of evaluated quantity is provided in the data tree as presented in the table below.
| Quantity | Restored information |
|---|---|
| Real scalar | The scalar quantity |
| Complex scalar |
The complex modulus
|
| Real vector |
The vector
|
| Complex vector |
The vector at instant t
|