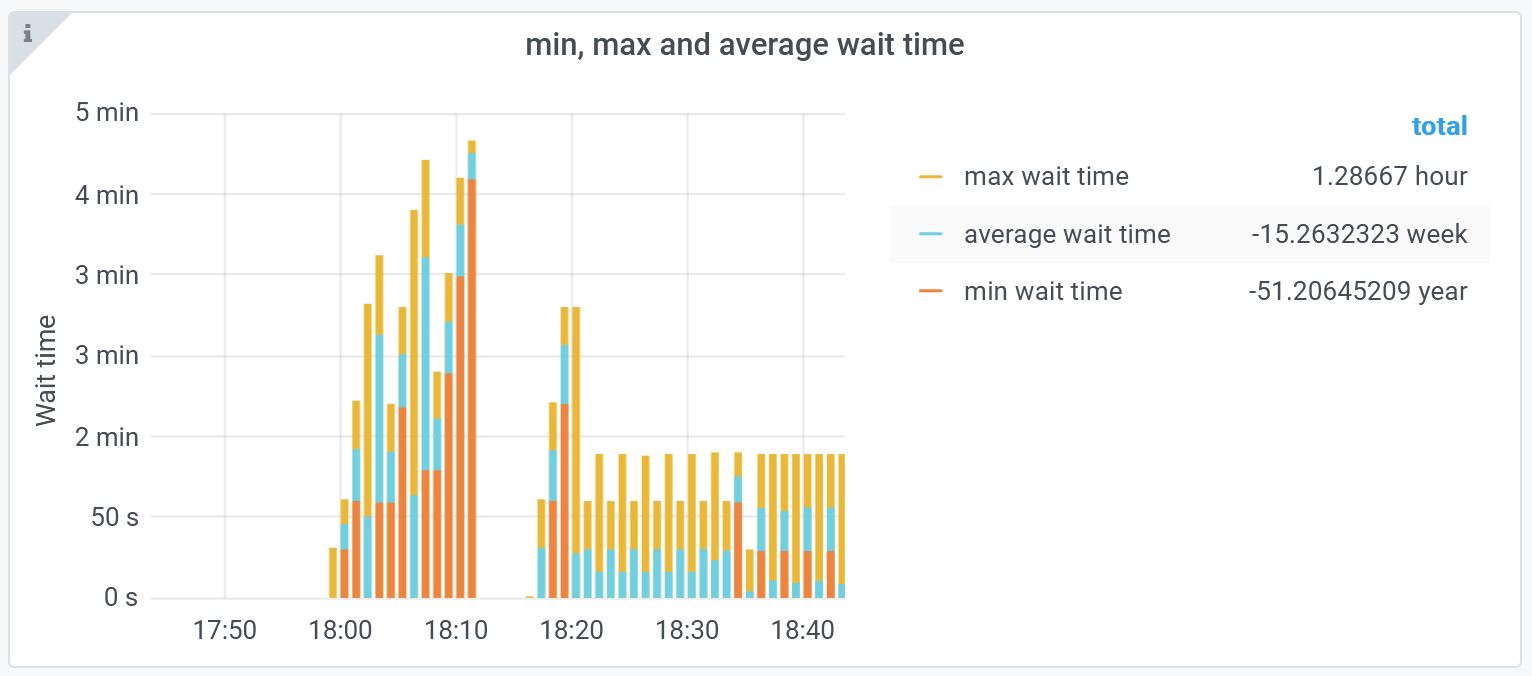
The real-time dashboard in Control (currently in preview release stage), provides live data in a single page to view
several aspects about the overall operation of a cluster.
The real-time dashboard in Control (currently in preview release stage), provides live data in a single page to view
several aspects about the overall operation of a cluster.
This chart provides the real-time details of the minimum, maximum and average wait
time for jobs in the cluster. Figure 1. Min, Max and Average Wait Time Chart