Plot Contour
Introduction
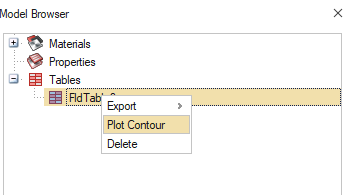
This option is used to draw contour for table values.

Tolerance
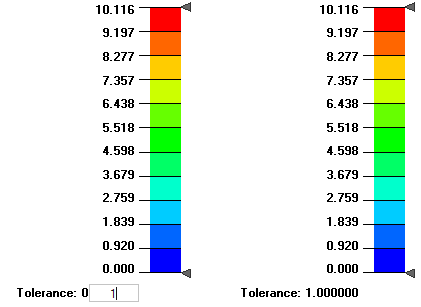
- Tolerance option will be displayed at the bottom of the legend bar for "Plot contour" option.
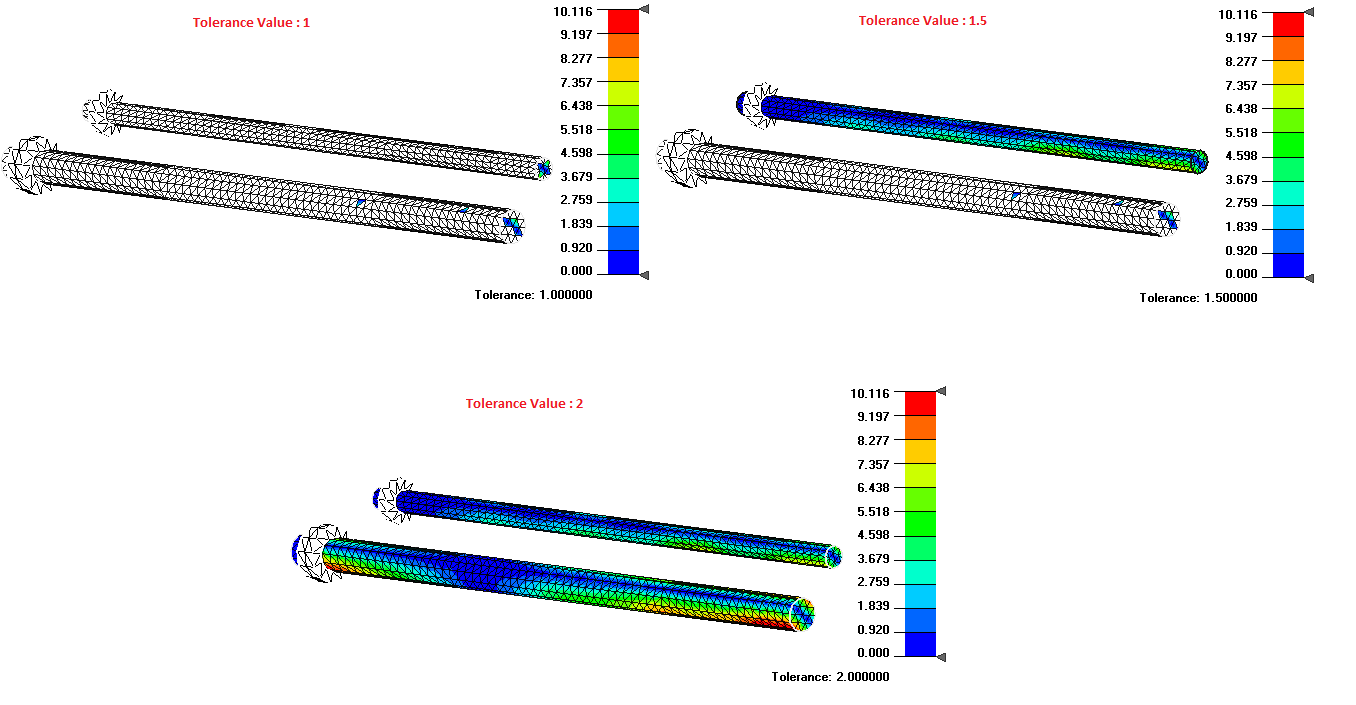
- Tolerance value is the search distance to get the contour values for the selected entities from the table XYZ values. Increase the tolerance if the contour is not drawn.
- User can modify tolerance value by pressing left mouse button over the tolerance
value on the graphics screen.

Example
