Contour
![]()
Dialog Box
This tool provides various options for contour display and Legend bar display.
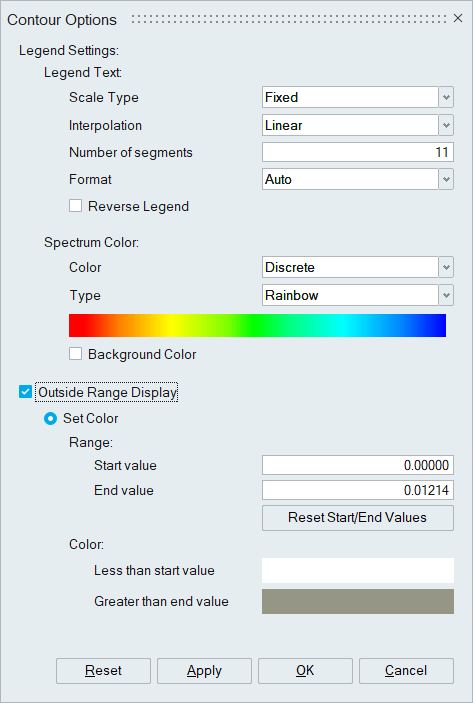
Legend Settings
- Legend Text
- Scale Type
- Fixed – Displays a fixed minimum and maximum value in the legend for the time steps that have already been processed.
- Dynamic – Changes the legend with respect to the maximum and minimum values of each time step or simulation.
- Interpolation
- Linear – Divides the legend segments into equal ranges in a linear manner.
- Logarithmic – Divides the legend segments in a logarithmic manner.
- If the result value range is invalid, the legend cannot be set to logarithmic interpolation. If the legend is already set to “Logarithmic”, changing the result data type or making changes to the load case/simulation, will lead to an invalid range. Consequently, the legend will revert to a Linear Interpolation. In such scenarios, the warning message “The current result range is invalid for logarithmic interpolation. The legend is switched to Linear Interpolation.” will be displayed.
- Number of Segments – The default segmentation split count is 10. The interval ranges from 1 to 25.
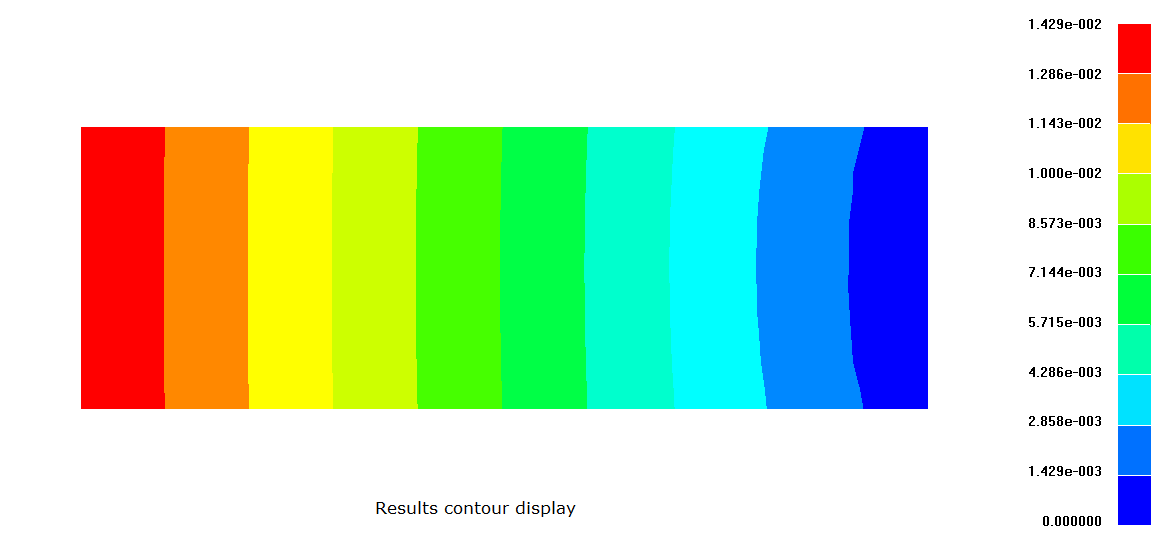
- Format - This option is used to set the legend bar value display
format. There are Auto, Exponential, and Float options.
- Auto: This mode will determine to use the format either exponential or float based on the current result value range. The precision is changed based on the current values.
- Exponential: Using this option to display the value in Exponential format.
- Float: Using this option to display the value in user define float format. It displays the value in the range of 2 to 9 decimal numbers. In the precision, edit box enters the value from 2 to 9 to display the decimal number in the legend bar.
- Reverse Legend – Reverse the legend values assigned to the color segments.
- Scale Type
- Spectrum Color
- Color
- Discrete - Discrete color bands on contour plots with distinct
boundaries between contour intervals.
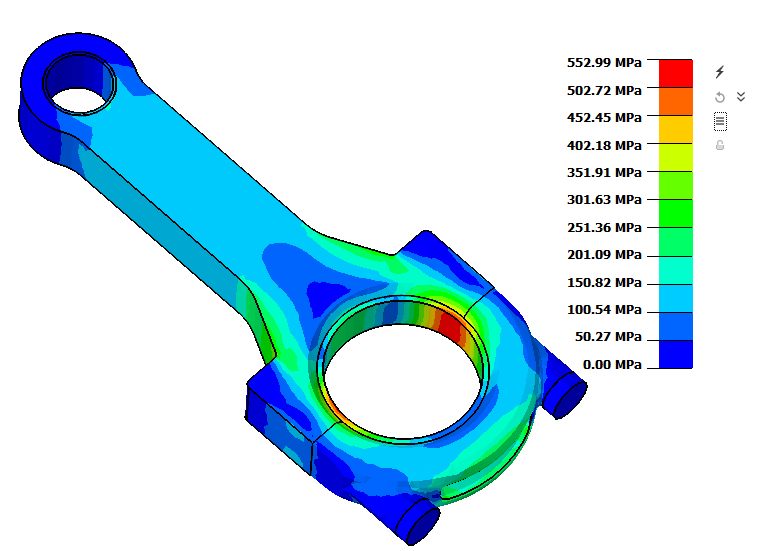
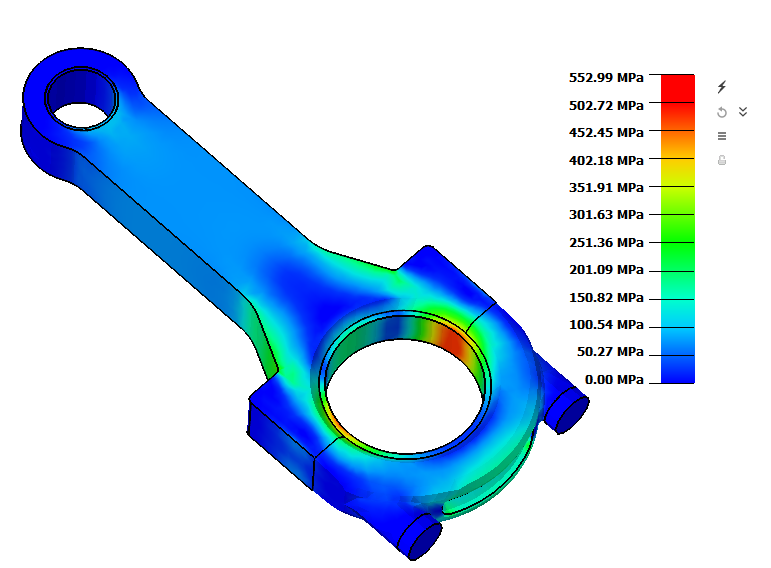
- Continuous - Colour bands on contour averaged between color intervals.
- Discrete - Discrete color bands on contour plots with distinct
boundaries between contour intervals.
- Segment type - The type of contour rendering can also be selected from the list of contour types. The different contour spectrums are Rainbow, Reverse Rainbow, Black to White, White to Black, Blue to Yellow, Red to Green, Green to Blue, Red to Blue.
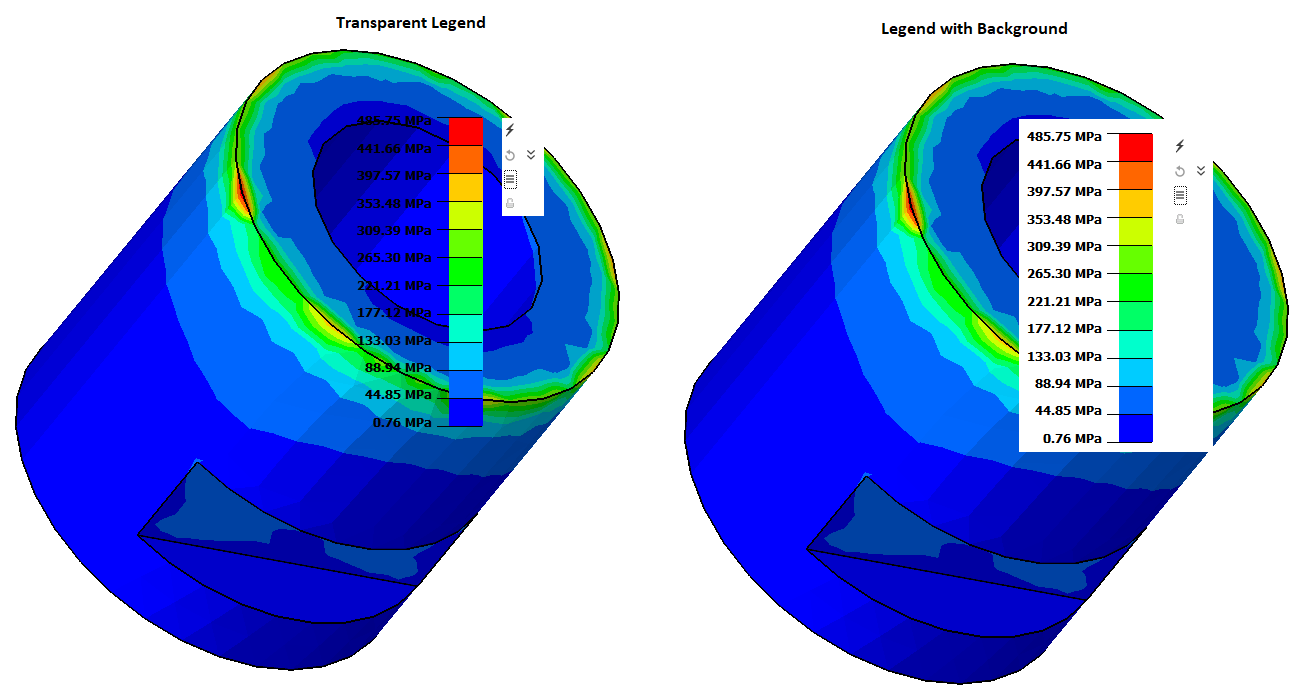
- Background Color – Display the legend with a background.
- Color
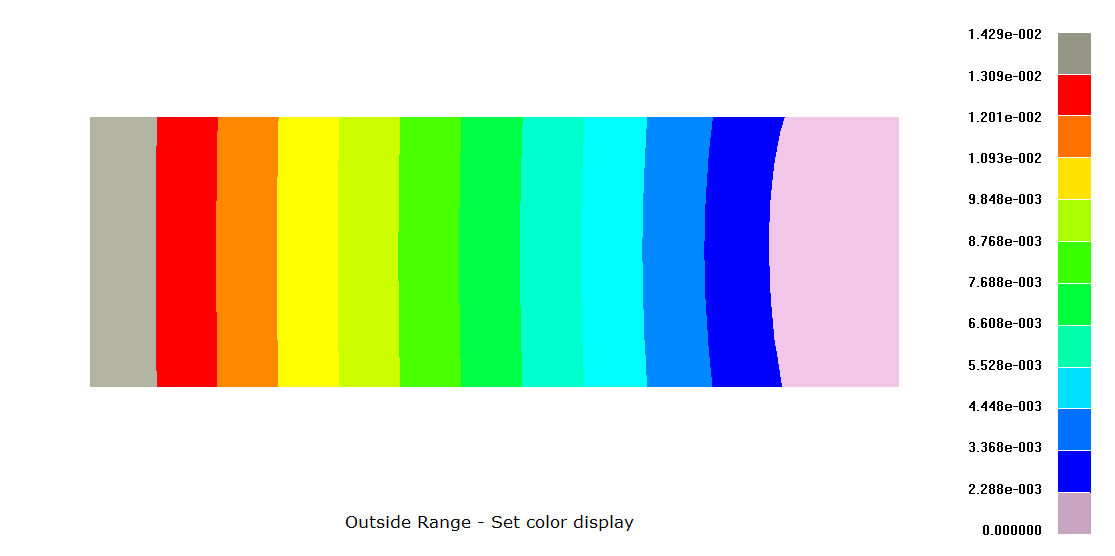
Outside range display
- Set color
The Minimum and Maximum value for the contour can be set by the user. If the result values are less than the minimum value the model will render default in White color. If the maximum result value in the model is greater than the user given maximum value the contour will be rendered in Gray color. By pressing the Reset Start/End value button it will reset the minimum and maximum value.