New Graphing Tool
Introduction
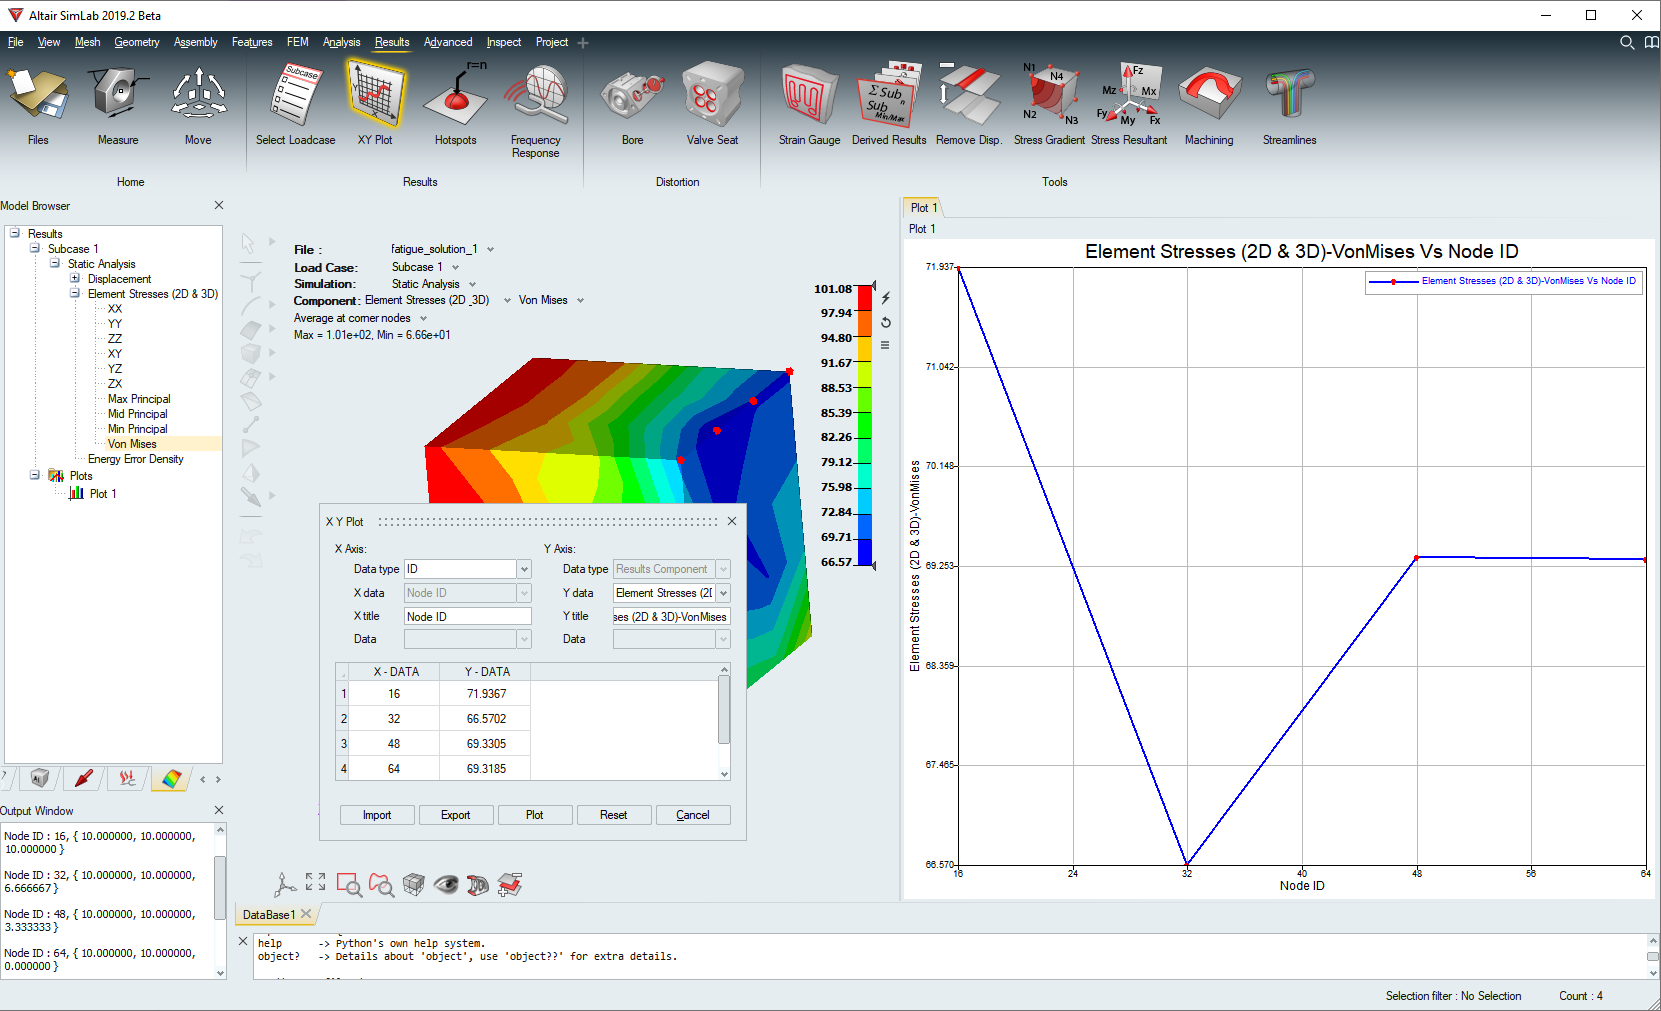
New Graphing tool is used to draw graph for given data. This tool mostly uses for result data plotting. To access the New Graphing tool, go to File | Preference | Results | Enable new graphing tool.New Graphing tool is supported only in the below tools:
- XY Plot
- Bore Distortion
- Mesh Convergence
- Field Table
Features
- It always appear as split window into the graphical area.
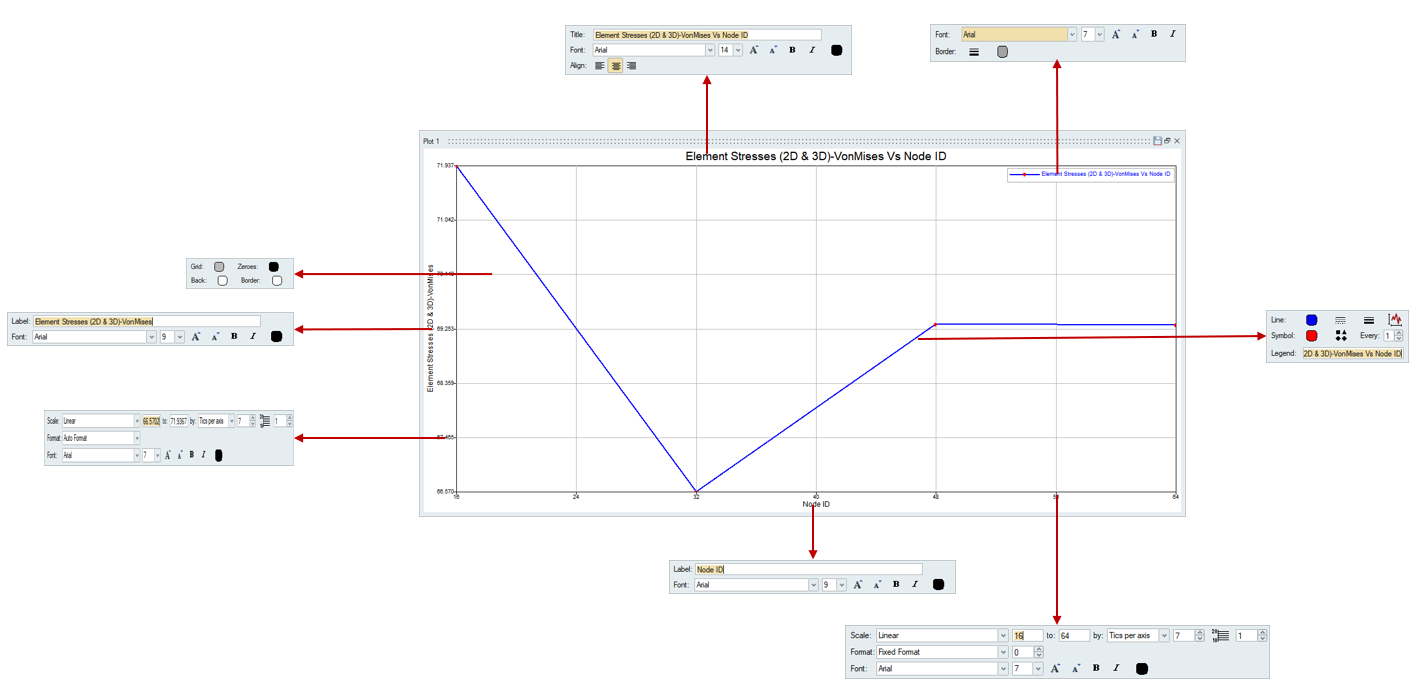
- It supports the user to modify graph properties and attributes easily like plot
titles, labels, axis labels, legends and tick mark labels.
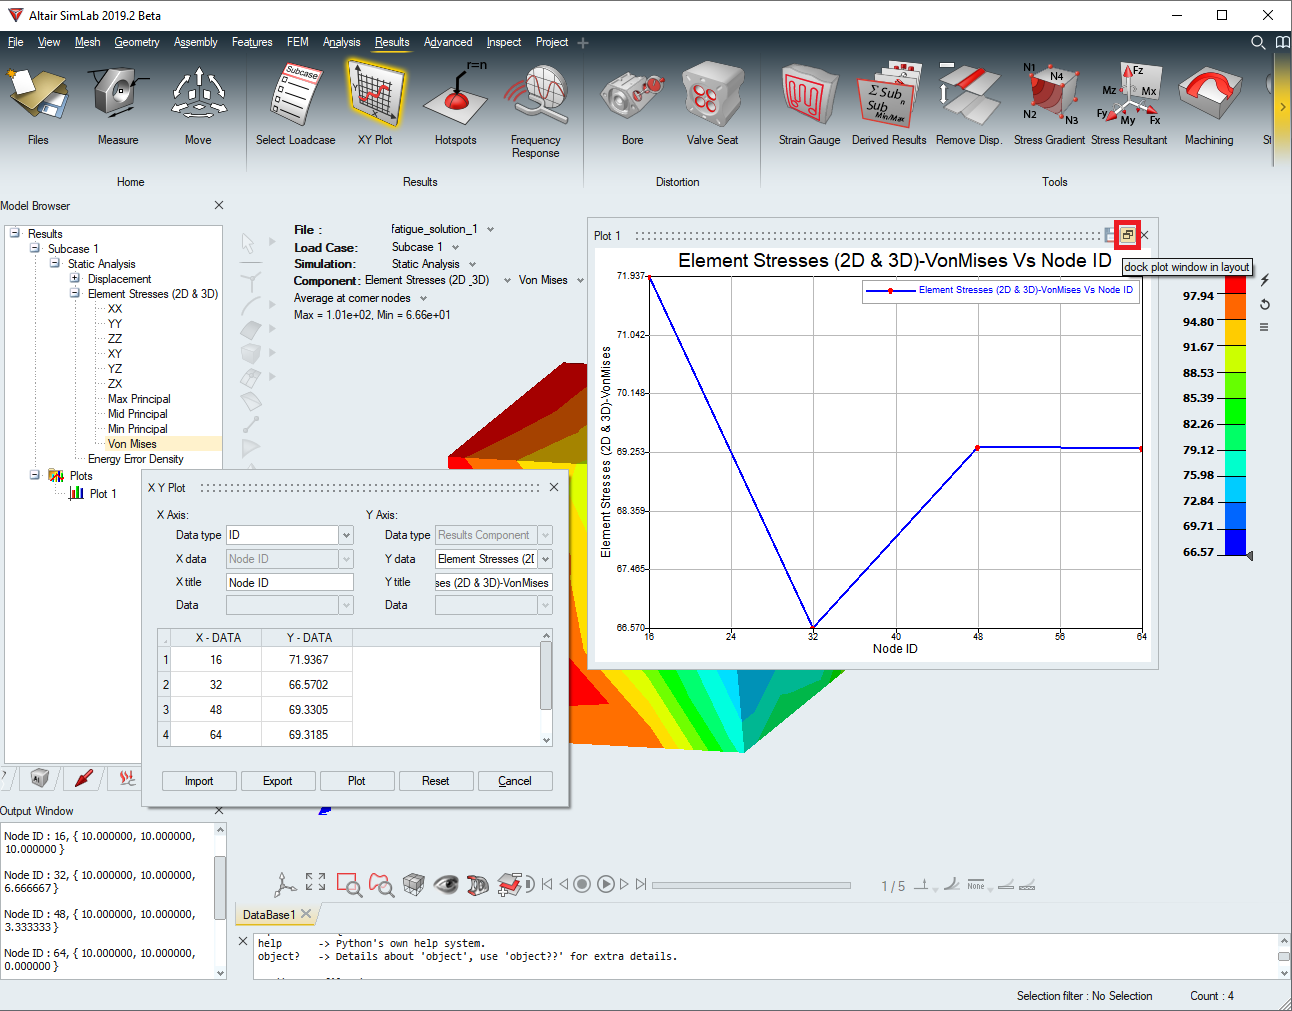
- It supports zoom, pan, dock and undock window.
- Button for Undock Plot Window
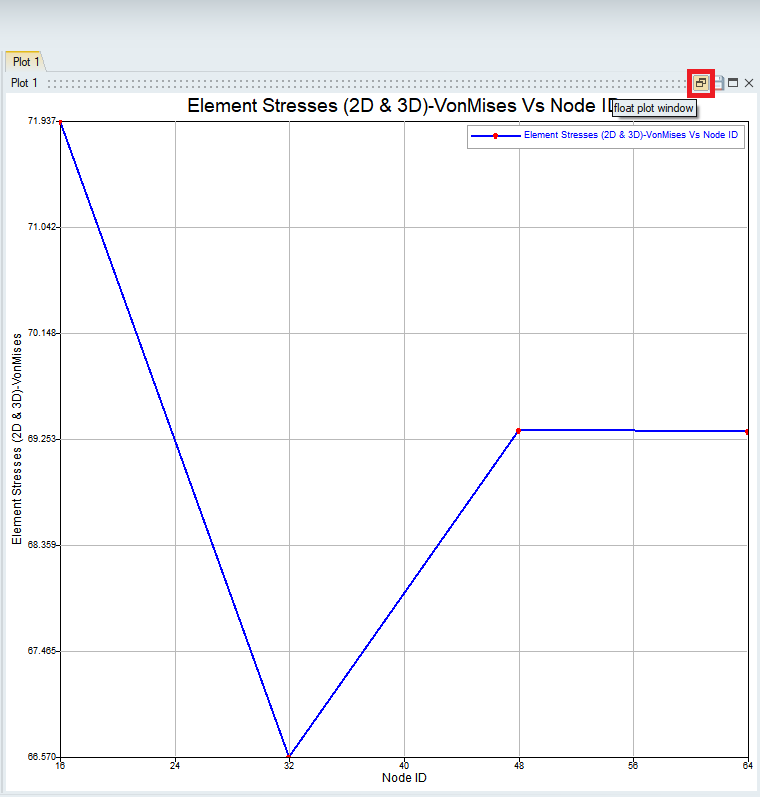
- Button for Dock Plot Window
- Button for Undock Plot Window
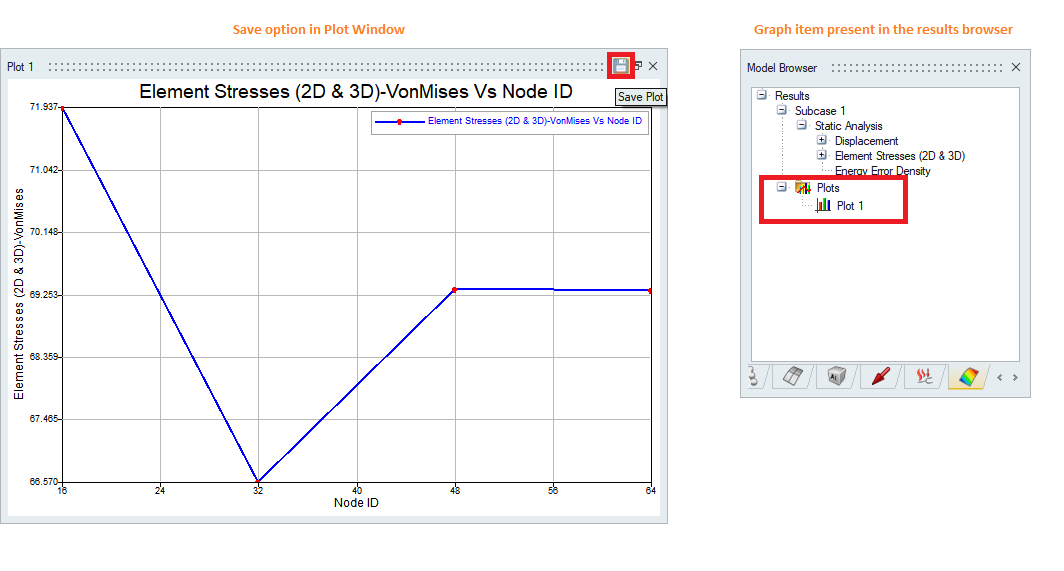
- User can save the plot graph further reference.Save option is available in the
right most top button on the graph window.This option saves the current plot in
the results tree view item.User can hide,show and delete the plot by this tree
view item.
- Button for Save Graph and Plot Item created in the results
browser
- Right click popup options for Plot Graph on the results
brower
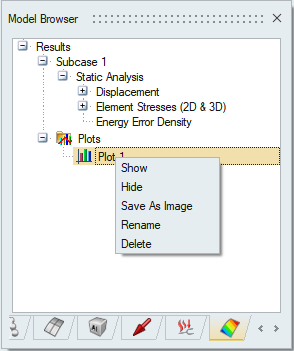
- Show → This option is used to show selected graph.
- Hide → This option is used to hide selected graph.
- Save As Image → This option is used to save graph in image format.
- Rename → This option is used to rename the caption of selected plot.
- Delete → This option is used to delete the selected plot.
- Button for Save Graph and Plot Item created in the results
browser