Display Properties
Use the options in the dialog display properties to define post-processing visualizations.
Display
-
To enable the surface coloring, turn the display on. If the display is off, it will color in the default color.
-
Select option to color surfaces based on constant color or with contours of scalars.
-
To enable vector display, turn the display on and select a vector.
-
Define a vector scale factor and select a vector display based on magnitude or uniform value. You can also control the resolution of the vector tip and shaft.
-
Select option to color vectors based on constant color or with contours of scalars.
-
To enable contour line display, turn the display on and select a vector.
-
Select option to color contour lines based on constant color or with contours of scalars.
-
To enable a mesh line display, turn the display on and select a vector.
-
Select the option to color mesh lines based on constant color or with contours of scalars.
-
To enable a feature line display, turn the display on and select a vector.
-
Select the option to color mesh lines based on constant color or with contours of scalars.
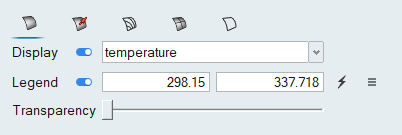
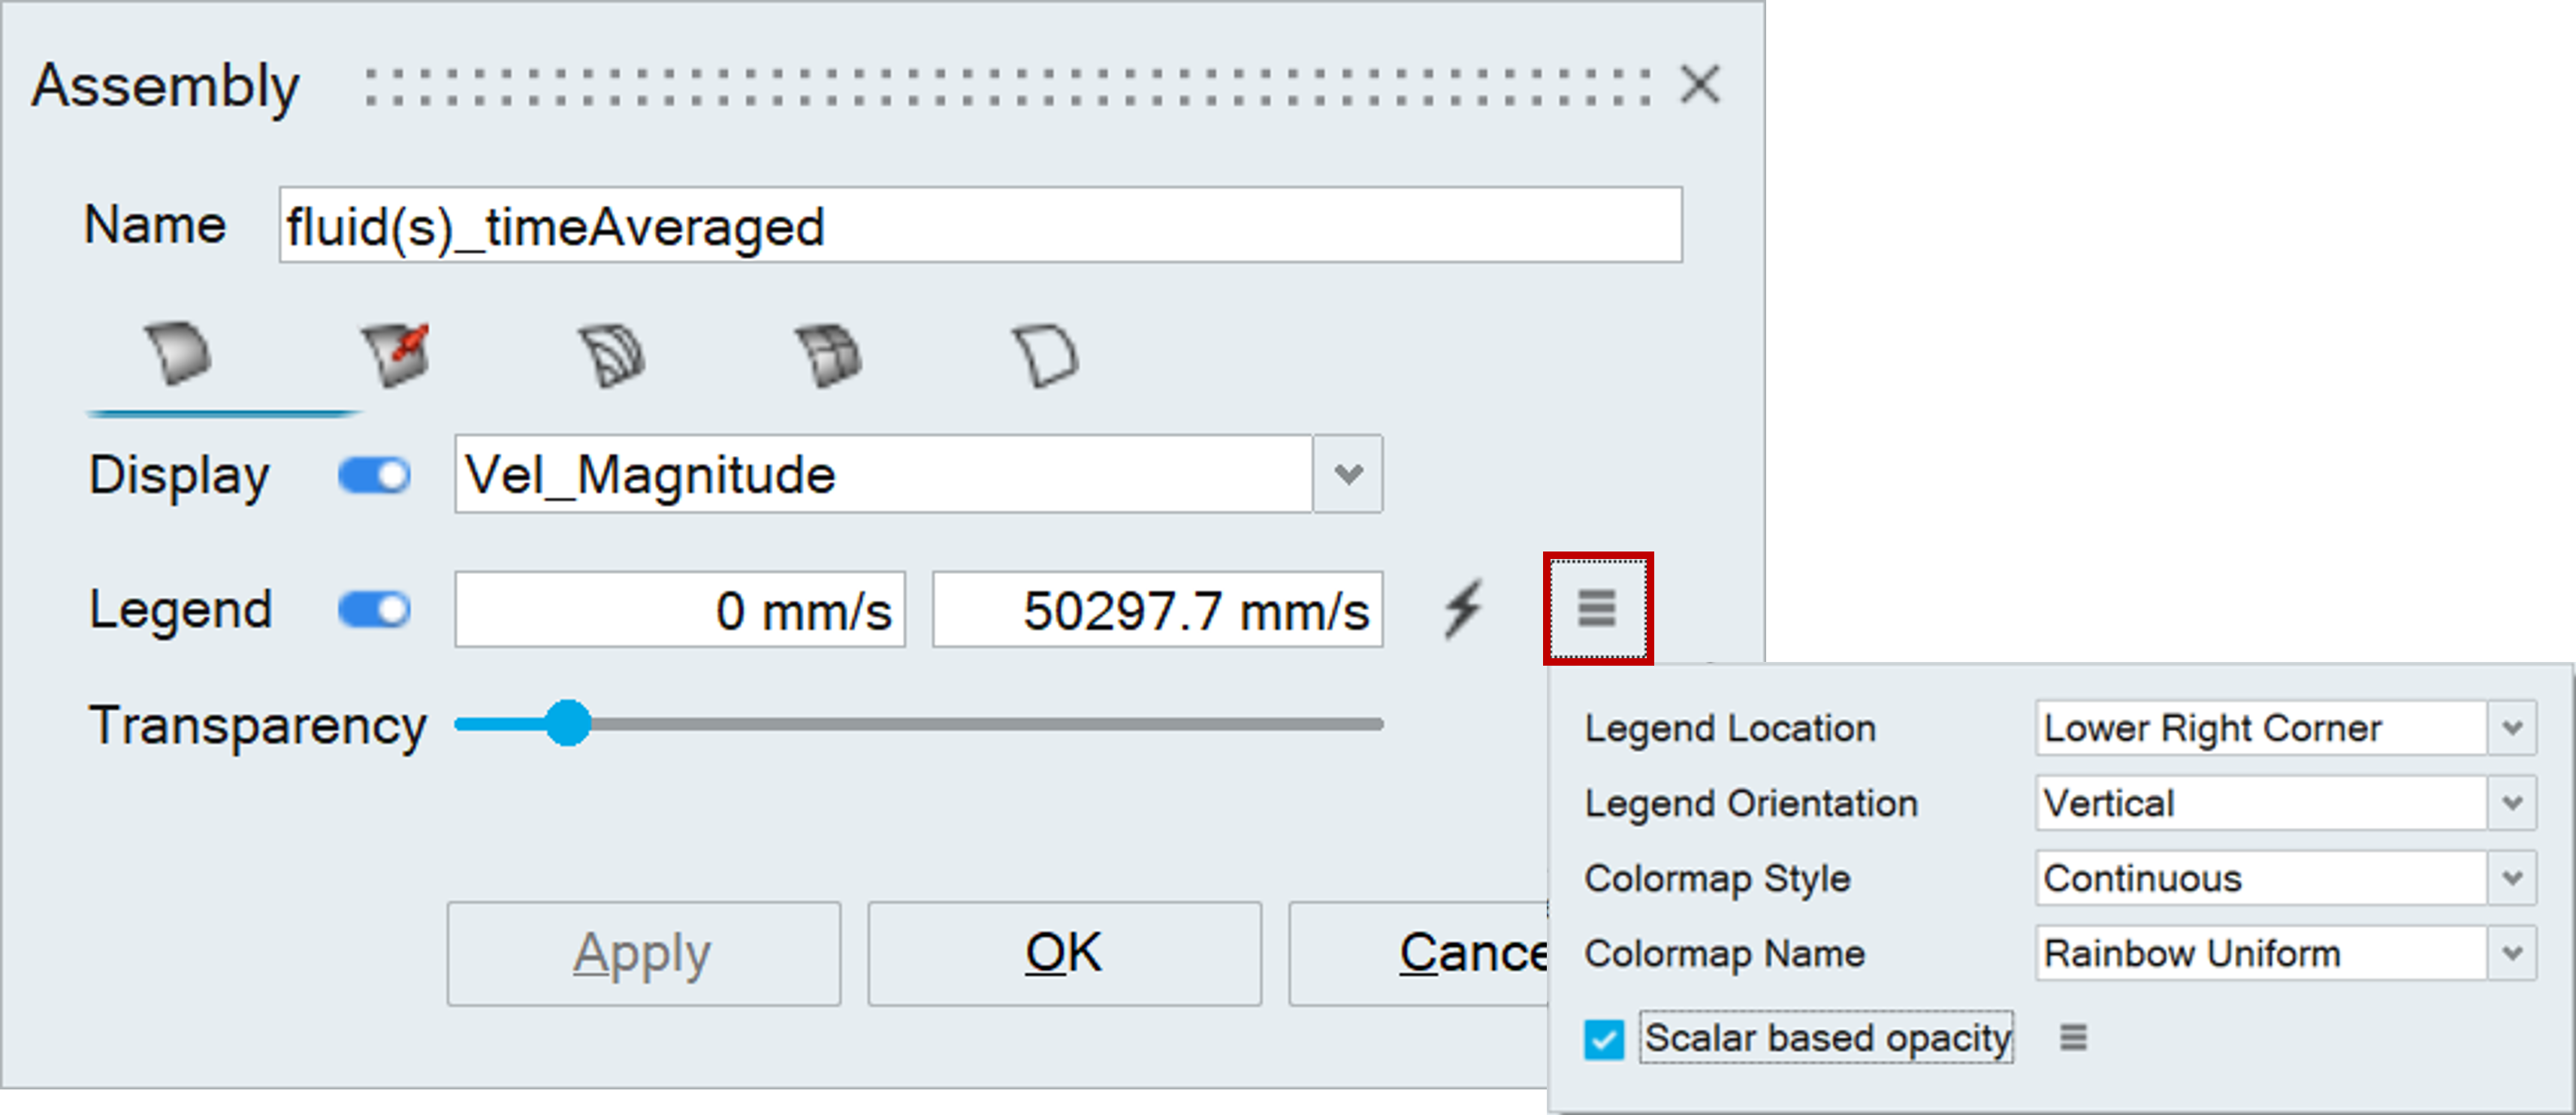
Legend
The minimum and maximum values of the displaying results component is shown. We have support to edit the legend values. Also have options to change the legend properties like legend location, legend orientation, colormap style, colormap name and Scalar based opacity.
Transparency
Use this option to adjust the transparency level for the display.