This manual describes the features and usage of the GateVision PRO GUI.
Overview
GateVision PRO is for logic designers, emulation engineers and test engineers, who need to analyze and see machine generated gate level structures. The tool works in many EDA (Electronic Design Automation) flows and offers compelling capabilities for verification, analysis and documentation. GateVision PRO reads in netlist design data in Verilog or EDIF 2.0.0 format and generates clearly laid out schematics.
Tooltips
If you place the mouse over an object, then after a small delay a tooltip label pops up. This label gives you additional context sensitive information or hints about the object that is displayed under the mouse cursor. In the Preferences dialog you can toggle the display of tooltips and the display of attributes in the tooltips.
Drag & Drop
The tool supports Drag & Drop with either the left or right mouse button.
The left mouse button is the default for Drag & Drop, but this can be configured in the Preferences dialog or using the command line option -dndButton.
You can start dragging one or more objects depending on how many objects are currently selected or where you start dragging from. While dragging is active, the mouse cursor changes. The "forbidden" cursor indicates an invalid drop zone; you may not drop objects here. The "dropped" objects will temporarily be highlighted with the Goto color (similar to the Goto function).
Dropping Objects to Inactive Tabs
If you want to drop objects on one of the Tab group’s tab that is currently not visible (not active) you can do the following: Drag the object(s) on one of Tab group’s tab name (the cursor changes) and hold this position for about half a second. The tab will be activated and you may drop the object(s) into the window, if possible. You can also drop directly to the tab name.
Highlight
The tool supports different global highlight lists, each represented by a different color. Any object of the design loaded in GateVision PRO can be highlighted. Highlighting is global, i.e. all Pane windows and their tabs like Schem, Cone, Source, Mem and Search realize a change in the highlight list.
To highlight the selected database object(s), use the context menu entry "Highlight" or press Ctrl+H. The selected object(s) will be highlighted in the current highlight color.
To unhighlight the selected database object(s), use the context menu entry "Unhighlight" or press Ctrl+Shift+H.
The main menu’s Highlight entries are:
-
The to sub-menu entries let the user choose the current highlighting color from a selection 16 highlight colors.
-
Enabling causes GateVision PRO to increment/change the current highlighting color after each highlight command.
-
The to sub-menu entries remove the highlight information from all database objects of a certain color.
-
removes the highlight information from all database objects.
Goto
If you invoke the "Goto" function using the context menu on the selected object in a Pane window, then the Pane window’s sub windows Schem, Cone, Source, Mem and Search will also show the selected object. To indicate the object it is colored with the "goto color". This coloring will disappear after the next mouse click (the Drag & Drop function works similar and also uses the "goto color").
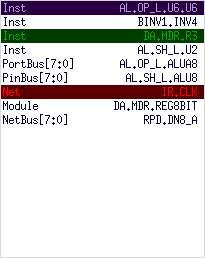
Object Identification
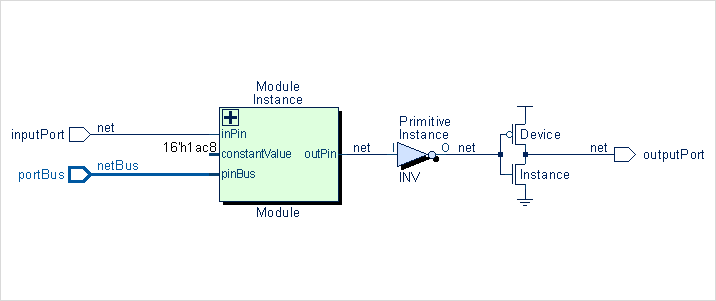
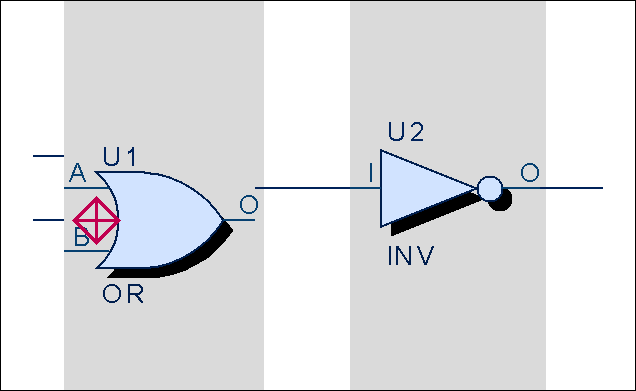
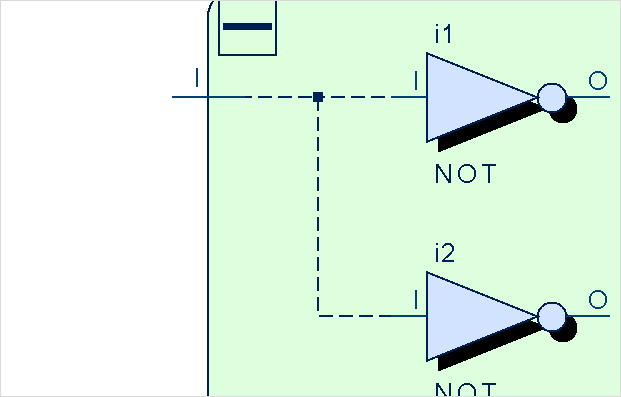
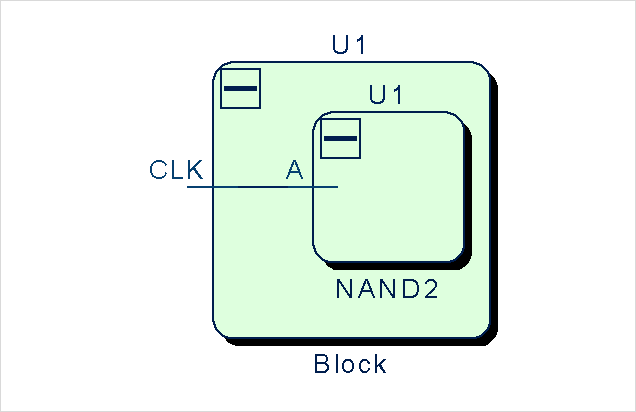
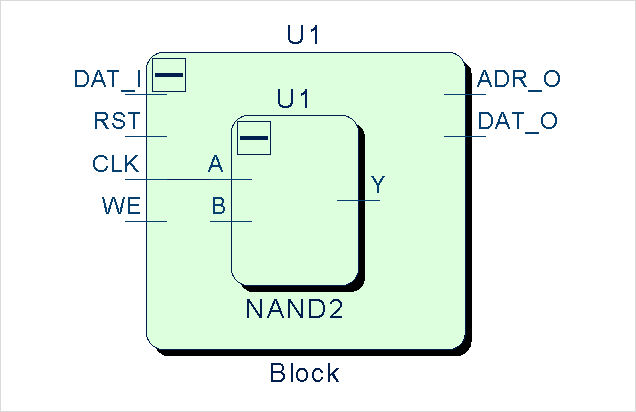
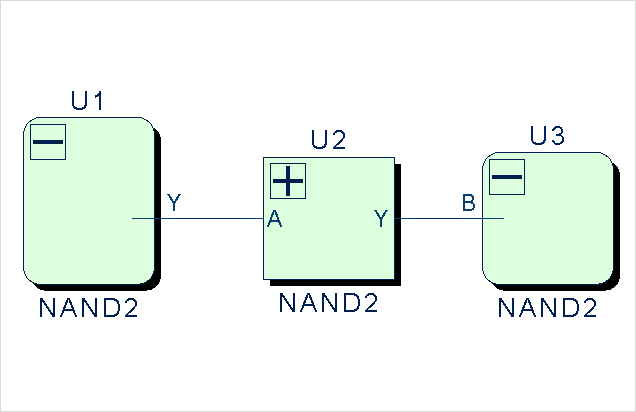
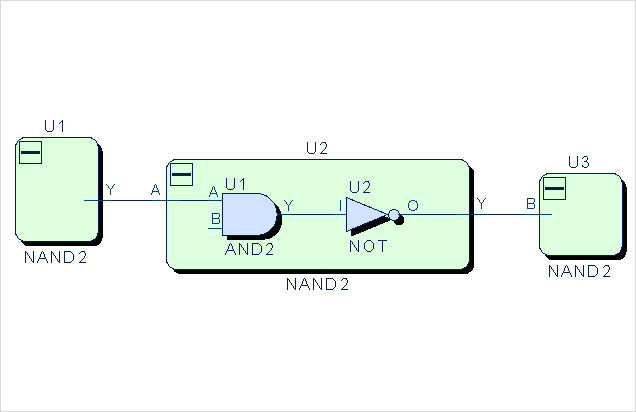
Individual "Objects" can be selected by mouse or highlighted or addressed through the Database API (for more information, please check out the Object Identification (OID) API and this UML diagram). All the GUI’s communication features like Drag & Drop, the Goto function, all kind of selection and highlighting, and especially the Memory and Search windows internally base on these Object IDs.
The image above shows an Instance of a Module, one Primitive Instance, two Device Instances, an input and an output Port, an input PortBus, Pins and a PinBus and some Nets and a NetBus.
The basic Object types are:
-
Instance - the instance of a Module or a Primitive.
-
Pin - an instance pin (refers to a Module/Primitive Port).
-
PinBus - an instance bus-pin (refers to a Module/Primitive PortBus).
-
Port - a Module/Primitive interface port.
-
PortBus - a Module/Primitive interface bus-port.
-
Net - a single-bit net connecting pins (and eventually a port).
-
NetBus - an array of nets.
-
Primitive - defines the Cell’s primitive function and the interface (not selectable in Schem or Cone windows).
-
Module - defines the interface and contents of a hierarchical block (not selectable in Schem or Cone windows).
Save Settings
There are two types of settings that can be saved:
-
GUI related user preferences can be saved as a workspace.
-
Design related settings can be saved as a project.
Workspace
The Workspace includes all user preferences (including color schemes).
Workspaces are managed via the menu.
You can start GateVision PRO with a certain workspace pre-loaded with the command line option -workspace.
Workspaces are plain text files with the default extension .ws.
Project
A project file includes all design related settings used to load the input files.
Projects are managed via the menu or in the Open Input Files dialog.
You can start GateVision PRO with a certain project pre-loaded with the command line option -project.
Projects are plain text files with the default extension .vpj.
Display Documentation
The Help function starts the "native" browser of the system to display the tool documentation. In the Preferences dialog you can change the command to invoke a browser.
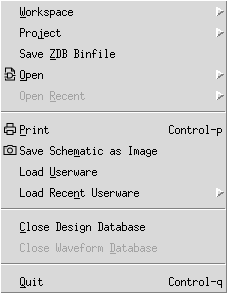
The Main Menu
The tool’s main menu looks like the following image:

You can activate the menu by mouse or by keyboard (if you press Alt and the underlined letter, e.g. Alt+V followed by P will show the Preferences dialog window from the View menu).
The GUI API allows the user to extend the main menu.
The following table shows the entries from the main menu:
| Menu Item | Description |
|---|---|
Open the File menu. |
|
Open the View menu. |
|
Open the Tools menu. |
|
Open the Window menu. |
|
Open the Highlight menu. |
|
Open the Help menu. |
The File Menu
| Menu Item | Description | Keyboard |
|---|---|---|
Start sub-menu to read/write workspace settings from/to file. |
||
Start sub-menu to read/write project settings from/to file. |
||
Save the current design as a precompiled binary database file (ZDB Binfile). |
||
Open the Open sub-menu. |
||
Open recent files. |
||
Open the Print dialog window. |
Ctrl+P |
|
Open the Save Schematic as Image dialog window. |
||
Load and execute a Tcl/Tk Userware script. |
||
Reload a previously opened Tcl/Tk Userware script. |
||
Close the opened design database. |
||
Close the opened waveform database. |
||
Close GateVision PRO. Before closing the application, a window will pop up to ask for confirmation. This can be omitted with a settings variable. [ |
Ctrl+Q |
The File/Workspace Menu
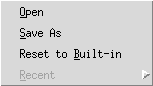
| Menu Item | Description | Keyboard |
|---|---|---|
Load a workspace by choosing the file in a dialog. |
||
Save current settings to a workspace file. |
||
Reset all global settings to the built-in defaults. |
||
List of recent workspace files. |
The File/Project Menu

| Menu Item | Description | Keyboard |
|---|---|---|
Load a Project by choosing the file in a dialog. |
||
Save current design related settings to a Project file. |
||
Create a new Project. |
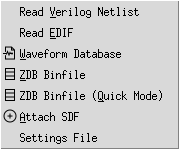
The File/Open Menu
| Menu Item | Description | Keyboard |
|---|---|---|
Open the Read Verilog Netlist dialog window. |
||
Open the Read EDIF dialog window. |
||
Open a Waveform database. |
||
Open a precompiled binary database file (ZDB Binfile). |
||
Open a precompiled binary database file (ZDB Binfile) in Quick Mode. |
||
Open the Attach SDF dialog window. |
||
Open a parser settings file. |
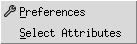
The View Menu
| Menu Item | Description | Keyboard |
|---|---|---|
Open the Preferences dialog window. |
||
Open the Select Display Attributes dialog window. |
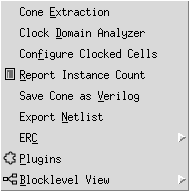
The Tools Menu
| Menu Item | Description | Keyboard |
|---|---|---|
Show the Cone Extraction dialog. |
||
Run automatic Clock Domain Extraction and Cross Domain Check. |
||
Manually configure Clocked Cells. |
||
Count and display the number of module/primitive instances. |
||
Save the contents of the Cone window As Verilog. |
||
Export the loaded design either as a Spice or Verilog netlist. |
||
Open the ERC sub-menu. |
||
Show the Plugins dialog window. |
||
Open the Blocklevel View sub-menu. |
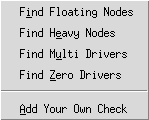
The Tools/ERC Menu
| Menu Item | Description | Keyboard |
|---|---|---|
Search for floating nodes. |
||
Search for heavily connected nodes. |
||
Search for signals with multiple drivers. |
||
Search for signals without any driver. |
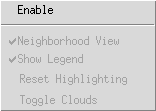
The Tools/Blocklevel View Menu
| Menu Item | Description | Keyboard |
|---|---|---|
Toggle the Blocklevel View mode. |
||
Show the selected instance’s neighbors in a neighborhood view. |
||
Display a legend explaining neighborhood colors. |
||
Reset the neighborhood highlighting. |
||
Merge logic gates into 'logic clouds' and back. |
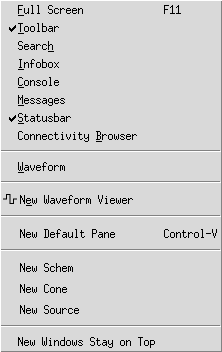
The Window Menu
| Menu Item | Description | Keyboard |
|---|---|---|
Toggle fullscreen mode of the main window. |
F11 |
|
Toggle the display of the Toolbar. |
||
Toggle the display of the Search window. |
||
Toggle the display of the Infobox window. |
||
Toggle the display of the Console window. |
||
Toggle the display of the Messages window. |
||
Toggle the display of the Statusbar. |
||
Toggle the display of the Connectivity Browser. |
||
Toggle the display of the Waveform window. |
||
Open a new toplevel Waveform window. |
||
Create a new Pane window with a set of default tabs. |
Ctrl+Shift+V |
|
Create a new toplevel Schematic window. |
||
Create a new toplevel Cone window. |
||
Create a new toplevel Source window. |
||
If activated, new Pane windows will stay on top of the main GUI. Technically spoken: "on" means "transient to" the main window and "off" means "independent from" the main window. |
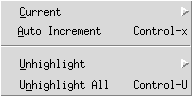
The Highlight Menu
| Menu Item | Description | Keyboard |
|---|---|---|
Choose the current highlighting color. |
||
If activated, the current highlighting color is 'incremented' after each highlighting command. |
Ctrl+X |
|
Remove the highlight information from all objects of a certain color. |
||
Remove the highlight information from all objects. |
Ctrl+Shift+U |
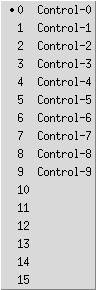
The Highlight/Current Menu
| Menu Item | Description | Keyboard |
|---|---|---|
Activate the highlight color associated with the number 0. |
Ctrl+0 |
|
Activate the highlight color associated with the number 1. |
Ctrl+1 |
|
Activate the highlight color associated with the number 2. |
Ctrl+2 |
|
Activate the highlight color associated with the number 3. |
Ctrl+3 |
|
Activate the highlight color associated with the number 4. |
Ctrl+4 |
|
Activate the highlight color associated with the number 5. |
Ctrl+5 |
|
Activate the highlight color associated with the number 6. |
Ctrl+6 |
|
Activate the highlight color associated with the number 7. |
Ctrl+7 |
|
Activate the highlight color associated with the number 8. |
Ctrl+8 |
|
Activate the highlight color associated with the number 9. |
Ctrl+9 |
|
Activate the highlight color associated with the number 10. |
||
Activate the highlight color associated with the number 11. |
||
Activate the highlight color associated with the number 12. |
||
Activate the highlight color associated with the number 13. |
||
Activate the highlight color associated with the number 14. |
||
Activate the highlight color associated with the number 15. |
The Highlight/Unhighlight Menu
| Menu Item | Description | Keyboard |
|---|---|---|
Unhighlight all highlights for the highlight color associated with the number 0. |
||
Unhighlight all highlights for the highlight color associated with the number 1. |
||
Unhighlight all highlights for the highlight color associated with the number 2. |
||
Unhighlight all highlights for the highlight color associated with the number 3. |
||
Unhighlight all highlights for the highlight color associated with the number 4. |
||
Unhighlight all highlights for the highlight color associated with the number 5. |
||
Unhighlight all highlights for the highlight color associated with the number 6. |
||
Unhighlight all highlights for the highlight color associated with the number 7. |
||
Unhighlight all highlights for the highlight color associated with the number 8. |
||
Unhighlight all highlights for the highlight color associated with the number 9. |
||
Unhighlight all highlights for the highlight color associated with the number 10. |
||
Unhighlight all highlights for the highlight color associated with the number 11. |
||
Unhighlight all highlights for the highlight color associated with the number 12. |
||
Unhighlight all highlights for the highlight color associated with the number 13. |
||
Unhighlight all highlights for the highlight color associated with the number 14. |
||
Unhighlight all highlights for the highlight color associated with the number 15. |
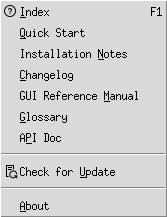
The Help Menu
| Menu Item | Description | Keyboard |
|---|---|---|
Open the start page of the documentation. |
F1 |
|
Open GateVision PRO’s Quick Start Guide. |
||
Show the Installation Notes. |
||
Display the list of changes in GateVision PRO. |
||
Open the GUI Reference Manual. |
||
Open the Glossary, explaining several terms (abbreviations/phrases/ words) used within GateVision PRO’s GUI and its documentation. |
||
Open the API Documentation. |
||
Open the About dialog: display version numbers and license details. |
The Context Menus
If you click on certain objects with the right mouse button, a context menu will pop up.
Most of the menu entries apply to the selected object(s).
Multiple selection with Ctrl and left mouse button is possible before pressing the right mouse button.
The upper part of the menu (above the separator line) stays the same for all windows whereas the lower part is different in each window (Schem, Cone, Source, Mem, etc.). Depending on the selected object(s) some of the functions are grayed out.
One of the context menu entries can be in bold font indicating the default action; he default action is performed if you double-click on the object with the left mouse button.
|
Note
|
If Drag & Drop is configured to the right mouse button it can also start Drag & Drop for the selected objects: press-move-release means Drag & Drop, while press-release means Popup context menu. |
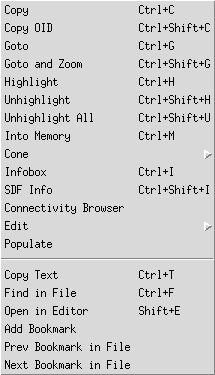
The Schem Popup Menu
The picture shows the context menu of the Schem window.
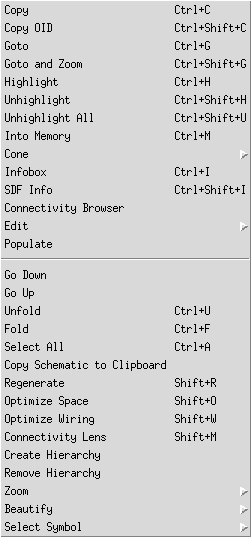
The following table describes all commands accessible from the Context Menu of the Schem window. The invoked command runs on the selected object(s). Multiple selection with Ctrl and left mouse button is possible before pressing the right mouse button.
| Popup Item (Schem) | Description | Keyboard |
|---|---|---|
Copy the name(s) of the selected object(s) to the clipboard. |
Ctrl+C |
|
Copy the Object ID(s) of the selected object(s) to the clipboard. |
Ctrl+Shift+C |
|
Goto the selected object(s) in each window. Each window will temporarily highlight the object(s) with the Goto color (the next mouse selection will remove the "Goto color"). |
Ctrl+G |
|
Goto and zoom to the selected object(s) in each window. |
Ctrl+Shift+G |
|
Highlight the selected object(s) with the current highlight color (0 to 15). The current highlight color is selected from the main menu or the toolbar. |
Ctrl+H |
|
Unhighlight the selected object(s). |
Ctrl+Shift+H |
|
Unhighlight all highlighted object(s) and remove all highlight information. |
Ctrl+Shift+U |
|
Add the selected object(s) into the Mem window. |
Ctrl+M |
|
The "Cone" sub-menu provides functions to add objects to the Cone window. |
||
Load the selected object(s) to the Cone window. |
Ctrl+L |
|
Load the selected net and its driver instance to the Cone window. |
Ctrl+N |
|
Append the selected object(s) to the Cone window. |
Ctrl+Shift+L |
|
Append the selected net and its driver instance to the Cone window. |
Ctrl+Shift+N |
|
Load a flat view of the selected hierarchical instance into the Cone window (similar to the Complete Hierarchy function). |
||
This is a shortcut to the often used features of the Cone Extraction dialog to append the paths to clocked cells respectively top-level I/O ports. |
||
Show the Cone Extraction dialog window. |
||
Show a dialog with additional information for the current selection. This includes also information about bus members of a bus. |
Ctrl+I |
|
Show timing information for the current selection. |
Ctrl+Shift+I |
|
The Connectivity Browser helps to examine a Net on the module level or a Signal (all interconnected nets as they pass hierarchy borders). There are functions to browse the connected pins and to display some or all connections in the Cone window. |
||
The Edit submenu provides functions to edit or add attributes to an object. |
||
Add comments to any object. |
Ctrl+O |
|
Populate the contents of this module from the binfile. |
||
Dive down and display the module below the selected object (like a double-click in the Schem window). |
||
Dive up and display the module above the currently displayed module. |
||
Unfold the hierarchy box to see the contents. |
Ctrl+U |
|
Fold the hierarchy box to hide the contents. |
Ctrl+F |
|
Select all objects. |
Ctrl+A |
|
Copy the current schematic view to the clipboard. |
||
Regenerate the displayed schematic. |
Shift+R |
|
Optimize the displayed module: keep the existing placement of ports and instances and also the net routing. Optimize the net length (in y direction) and compact the y-space between components. |
Shift+O |
|
Optimize the wiring of the displayed module: keep the placement of ports and instances but optimizes the net routing. |
Shift+W |
|
Show an internal window with detailed connectivity information for the selected pinBus or portBus object. |
Shift+M |
|
Create an artificial level of hierarchy around the selected instances. |
||
Remove the selected hierarchical instance. if signal mode is enabled all modules in the path get singlized first. |
||
Provide schematic zoom operations. |
||
Make the full schematic fit the window (not including the page frame and not any space around the schematic). |
F |
|
Zoom in. |
I |
|
Zoom out. |
O |
|
Make the full page size fit the window - including the page frame. |
Shift+F |
|
Set zoom level to 1. |
1 |
|
Zoom to the selected object. |
Shift+G |
|
The functions in this sub-menu allow you to beautify the schematic: hiding ports, rotate and mirror instances, place several instances in the same column, set the location of a port to top, bottom, left, or right. |
||
The Rotate submenu provides functions to rotate instances. |
||
Rotate the selected instances by 90 degrees. |
||
Rotate the selected instances by 180 degrees. |
||
Rotate the selected instances by 270 degrees. |
||
Mirror the selected instances along the X axis. |
||
Mirror the selected instances along the Y axis. |
||
The Location submenu provides functions to set the location for pins or ports. |
||
Set the location of the selected pin or port to 'Left'. |
||
Set the location of the selected pin or port to 'Right'. |
||
Set the location of the selected pin or port to 'Top'. |
||
Set the location of the selected pin or port to 'Bottom'. |
||
All selected instances will be displayed in one column. |
||
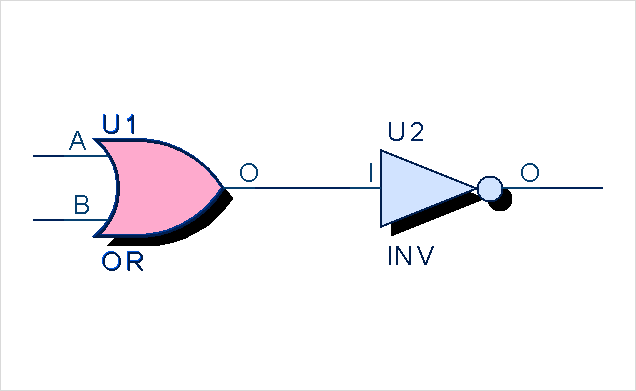
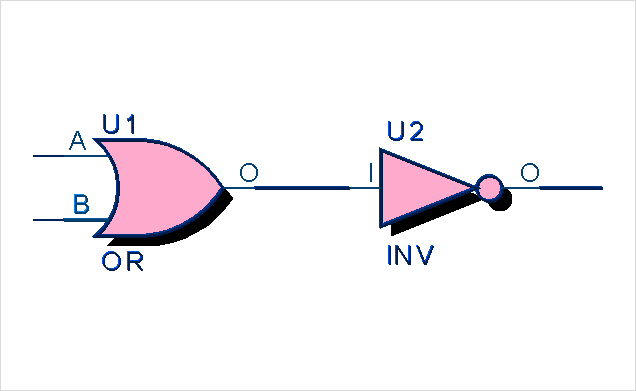
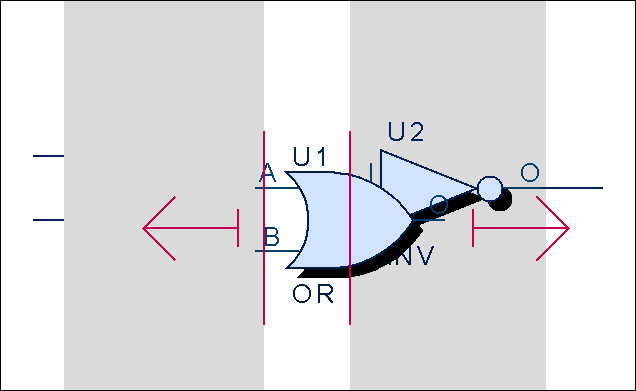
The Select Symbol submenu provides functions to set the symbol shape for the cell (with no primitive function) of the selected instance (with exactly one output port). |
||
Set the symbol shape to 'BOX' at the selected instance. |
||
Set the symbol shape to 'BUF' at the selected instance. |
||
Set the symbol shape to 'INV' at the selected instance. |
||
Set the symbol shape to 'AND' at the selected instance. |
||
Set the symbol shape to 'NAND' at the selected instance. |
||
Set the symbol shape to 'OR' at the selected instance. |
||
Set the symbol shape to 'NOR' at the selected instance. |
||
Set the symbol shape to 'XOR' at the selected instance. |
||
Set the symbol shape to 'XNOR' at the selected instance. |
||
Set the symbol shape to 'MUX' at the selected instance. |
||
Open a dialog to select a symbol shape and define a port mapping. |
The Cone Popup Menu
The picture shows the context menu of the Cone window.
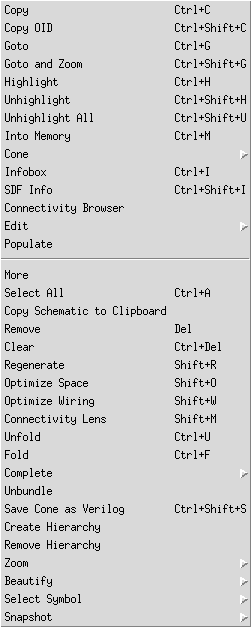
The following table describes all commands accessible from the Context Menu of the Cone window. The invoked command runs on the selected object(s). Multiple selection with Ctrl and left mouse button is possible before pressing the right mouse button.
| Popup Item (Cone) | Description | Keyboard |
|---|---|---|
Copy the name(s) of the selected object(s) to the clipboard. |
Ctrl+C |
|
Copy the Object ID(s) of the selected object(s) to the clipboard. |
Ctrl+Shift+C |
|
Goto the selected object(s) in each window. Each window will temporarily highlight the object(s) with the Goto color (the next mouse selection will remove the "Goto color"). |
Ctrl+G |
|
Goto and zoom to the selected object(s) in each window. |
Ctrl+Shift+G |
|
Highlight the selected object(s) with the current highlight color (0 to 15). The current highlight color is selected from the main menu or the toolbar. |
Ctrl+H |
|
Unhighlight the selected object(s). |
Ctrl+Shift+H |
|
Unhighlight all highlighted object(s) and remove all highlight information. |
Ctrl+Shift+U |
|
Add the selected object(s) into the Mem window. |
Ctrl+M |
|
The "Cone" sub-menu provides functions to add objects to the Cone window. |
||
Load the selected object(s) to the Cone window. |
Ctrl+L |
|
Load the selected net and its driver instance to the Cone window. |
Ctrl+N |
|
Append the selected object(s) to the Cone window. |
Ctrl+Shift+L |
|
Append the selected net and its driver instance to the Cone window. |
Ctrl+Shift+N |
|
Load a flat view of the selected hierarchical instance into the Cone window (similar to the Complete Hierarchy function). |
||
This is a shortcut to the often used features of the Cone Extraction dialog to append the paths to clocked cells respectively top-level I/O ports. |
||
Show the Cone Extraction dialog window. |
||
Show a dialog with additional information for the current selection. This includes also information about bus members of a bus. |
Ctrl+I |
|
Show timing information for the current selection. |
Ctrl+Shift+I |
|
The Connectivity Browser helps to examine a Net on the module level or a Signal (all interconnected nets as they pass hierarchy borders). There are functions to browse the connected pins and to display some or all connections in the Cone window. |
||
The Edit submenu provides functions to edit or add attributes to an object. |
||
Add comments to any object. |
Ctrl+O |
|
Populate the contents of this module from the binfile. |
||
Incrementally extend the schematic excerpt (like a double-click in the Cone window). |
||
Select all objects. |
Ctrl+A |
|
Copy the current Cone schematic view to the clipboard. |
||
Remove the selected object(s) from the window. |
Del |
|
Clear the window (remove all objects from the window). |
Ctrl+Del |
|
Regenerate the displayed schematic. |
Shift+R |
|
Optimize the displayed module: keep the existing placement of ports and instances and also the net routing. Optimize the net length (in y direction) and compact the y-space between components. |
Shift+O |
|
Optimize the wiring of the displayed module: keep the placement of ports and instances but optimize the net routing. |
Shift+W |
|
Show an internal window with detailed connectivity information for the selected pinBus or portBus object. |
Shift+M |
|
Unfold the hierarchy box to see the contents. |
Ctrl+U |
|
Fold the hierarchy box to hide the contents. |
Ctrl+F |
|
The "Complete" sub-menu provides some functions to add contents to the selected hierarchical instance. |
||
Add all objects of the down-module |
Ctrl+T |
|
Add all objects on all hierarchy levels below. |
Ctrl+Shift+T |
|
Add all objects on all hierarchy levels below and fold the selected hierarchical instance. |
||
The selected netBus is split into individual nets. |
||
The contents of the Cone window is saved as a Verilog netlist. |
Ctrl+Shift+S |
|
Create an artificial level of hierarchy around the selected instances. |
||
Remove the selected hierarchical instance. |
||
Provide schematic zoom operations. |
||
Make the full schematic fit the window (not including the page frame and not any space around the schematic). |
F |
|
Zoom in. |
I |
|
Zoom out. |
O |
|
Make the full page size fit the window - including the page frame. |
Shift+F |
|
Set zoom level to 1. |
1 |
|
Zoom to the selected object. |
Shift+G |
|
The functions in this sub-menu allow you to beautify the schematic: hiding ports, rotate and mirror instances, place several instances in the same column, set the location of a port to top, bottom, left, or right. |
||
The Rotate submenu provides functions to rotate instances. |
||
Rotate the selected instances by 90 degrees. |
||
Rotate the selected instances by 180 degrees. |
||
Rotate the selected instances by 270 degrees. |
||
Mirror the selected instances along the X axis. |
||
Mirror the selected instances along the Y axis. |
||
The Location submenu provides functions to set the location for pins or ports. |
||
Set the location of the selected pin or port to 'Left'. |
||
Set the location of the selected pin or port to 'Right'. |
||
Set the location of the selected pin or port to 'Top'. |
||
Set the location of the selected pin or port to 'Bottom'. |
||
All selected instances will be displayed in one column. |
||
The Select Symbol submenu provides functions to set the symbol shape for the cell (with no primitive function) of the selected instance (with exactly one output port). |
||
Set the symbol shape to 'BOX' at the selected instance. |
||
Set the symbol shape to 'BUF' at the selected instance. |
||
Set the symbol shape to 'INV' at the selected instance. |
||
Set the symbol shape to 'AND' at the selected instance. |
||
Set the symbol shape to 'NAND' at the selected instance. |
||
Set the symbol shape to 'OR' at the selected instance. |
||
Set the symbol shape to 'NOR' at the selected instance. |
||
Set the symbol shape to 'XOR' at the selected instance. |
||
Set the symbol shape to 'XNOR' at the selected instance. |
||
Set the symbol shape to 'MUX' at the selected instance. |
||
Open a dialog to select a symbol shape and define a port mapping. |
||
The "Snapshot" sub-menu supports Save and Restore the contents of the Cone window. |
||
Save the contents of the Cone window as a Snapshot file. |
Ctrl+S |
|
Restore the contents of the Cone window from a Snapshot file. |
Ctrl+Shift+O |
|
Restore the contents of the Cone window from a Snapshot file and validate it against the loaded database. All invalid objects and connections are removed. |
||
Restore the contents of the Cone window from a Snapshot file and validate it against the loaded database. All invalid objects and connections are grayed out. |
The Source Popup Menu
The picture shows the context menu of the Source window.
The following table describes all commands accessible from the Context Menu of the Source window. The invoked command runs on the selected object(s). Multiple selection with Ctrl and left mouse button is possible before pressing the right mouse button.
| Popup Item (Source) | Description | Keyboard |
|---|---|---|
Copy the name(s) of the selected object(s) to the clipboard. |
Ctrl+C |
|
Copy the Object ID(s) of the selected object(s) to the clipboard. |
Ctrl+Shift+C |
|
Goto the selected object(s) in each window. Each window will temporarily highlight the object(s) with the Goto color (the next mouse selection will remove the "Goto color"). |
Ctrl+G |
|
Goto and zoom to the selected object(s) in each window. |
Ctrl+Shift+G |
|
Highlight the selected object(s) with the current highlight color (0 to 15). The current highlight color is selected from the main menu or the toolbar. |
Ctrl+H |
|
Unhighlight the selected object(s). |
Ctrl+Shift+H |
|
Unhighlight all highlighted object(s) and remove all highlight information. |
Ctrl+Shift+U |
|
Add the selected object(s) into the Mem window. |
Ctrl+M |
|
The "Cone" sub-menu provides functions to add objects to the Cone window. |
||
Load the selected object(s) to the Cone window. |
Ctrl+L |
|
Load the selected net and its driver instance to the Cone window. |
Ctrl+N |
|
Append the selected object(s) to the Cone window. |
Ctrl+Shift+L |
|
Append the selected net and its driver instance to the Cone window. |
Ctrl+Shift+N |
|
Load a flat view of the selected hierarchical instance into the Cone window (similar to the Complete Hierarchy function). |
||
This is a shortcut to the often used features of the Cone Extraction dialog to append the paths to clocked cells respectively top-level I/O ports. |
||
Show the Cone Extraction dialog window. |
||
Show a dialog with additional information for the current selection. This includes also information about bus members of a bus. |
Ctrl+I |
|
Show timing information for the current selection. |
Ctrl+Shift+I |
|
The Connectivity Browser helps to examine a Net on the module level or a Signal (all interconnected nets as they pass hierarchy borders). There are functions to browse the connected pins and to display some or all connections in the Cone window. |
||
The Edit submenu provides functions to edit or add attributes to an object. |
||
Add comments to any object. |
Ctrl+O |
|
Populate the contents of this module from the binfile. |
||
Copy the selected text to the clipboard. |
Ctrl+T |
|
Search for a pattern in the currently displayed file. |
Ctrl+F |
|
Open the file in an external editor. |
Shift+E |
|
Add a bookmark in the Source window. |
||
Jump to the previous bookmark in the current source file. |
||
Jump to the next bookmark in the current source file. |
The Tree Popup Menu
The picture shows the context menu of the Tree window.
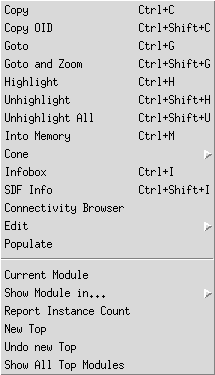
The following table describes all commands accessible from the Context Menu of the Tree window. The invoked command runs on the selected object.
| Popup Item (Tree) | Description | Keyboard |
|---|---|---|
Copy the name(s) of the selected object(s) to the clipboard. |
Ctrl+C |
|
Copy the Object ID(s) of the selected object(s) to the clipboard. |
Ctrl+Shift+C |
|
Goto the selected object(s) in each window. Each window will temporarily highlight the object(s) with the Goto color (the next mouse selection will remove the "Goto color"). |
Ctrl+G |
|
Goto and zoom to the selected object(s) in each window. |
Ctrl+Shift+G |
|
Highlight the selected object(s) with the current highlight color (0 to 15). The current highlight color is selected from the main menu or the toolbar. |
Ctrl+H |
|
Unhighlight the selected object(s). |
Ctrl+Shift+H |
|
Unhighlight all highlighted object(s) and remove all highlight information. |
Ctrl+Shift+U |
|
Add the selected object(s) into the Mem window. |
Ctrl+M |
|
The "Cone" sub-menu provides functions to add objects to the Cone window. |
||
Load the selected object(s) to the Cone window. |
Ctrl+L |
|
Load the selected net and its driver instance to the Cone window. |
Ctrl+N |
|
Append the selected object(s) to the Cone window. |
Ctrl+Shift+L |
|
Append the selected net and its driver instance to the Cone window. |
Ctrl+Shift+N |
|
Load a flat view of the selected hierarchical instance into the Cone window (similar to the Complete Hierarchy function). |
||
This is a shortcut to the often used features of the Cone Extraction dialog to append the paths to clocked cells respectively top-level I/O ports. |
||
Show the Cone Extraction dialog window. |
||
Show a dialog with additional information for the current selection. This includes also information about bus members of a bus. |
Ctrl+I |
|
Show timing information for the current selection. |
Ctrl+Shift+I |
|
The Connectivity Browser helps to examine a Net on the module level or a Signal (all interconnected nets as they pass hierarchy borders). There are functions to browse the connected pins and to display some or all connections in the Cone window. |
||
The Edit submenu provides functions to edit or add attributes to an object. |
||
Add comments to any object. |
Ctrl+O |
|
Populate the contents of this module from the binfile. |
||
The selected module will become the current module and it will be loaded and displayed in the Schem window (like a double-click in the Tree). |
||
Show the selected module in an existing Schem window, a new Schem window in an existing Tab, or in a new top-level Schem window. |
||
Count the number of module/primitive instances starting at the selected module. |
||
Make this module the new top module. |
||
Undo the top module. |
||
Show all available top modules. This option is available if top module is not defined. |
The Mem Popup Menu
The picture shows the context menu of the Mem window.
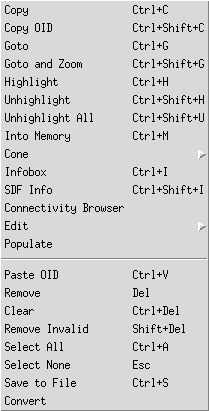
The following table describes all commands accessible from the Context Menu of the Mem window. The invoked command runs on the selected object(s). Multiple selection with Ctrl and left mouse button is possible before pressing the right mouse button.
| Popup Item (Mem) | Description | Keyboard |
|---|---|---|
Copy the name(s) of the selected object(s) to the clipboard. |
Ctrl+C |
|
Copy the Object ID(s) of the selected object(s) to the clipboard. |
Ctrl+Shift+C |
|
Goto the selected object(s) in each window. Each window will temporarily highlight the object(s) with the Goto color (the next mouse selection will remove the "Goto color"). |
Ctrl+G |
|
Goto and zoom to the selected object(s) in each window. |
Ctrl+Shift+G |
|
Highlight the selected object(s) with the current highlight color (0 to 15). The current highlight color is selected from the main menu or the toolbar. |
Ctrl+H |
|
Unhighlight the selected object(s). |
Ctrl+Shift+H |
|
Unhighlight all highlighted object(s) and remove all highlight information. |
Ctrl+Shift+U |
|
Add the selected object(s) into the Mem window. |
Ctrl+M |
|
The "Cone" sub-menu provides functions to add objects to the Cone window. |
||
Load the selected object(s) to the Cone window. |
Ctrl+L |
|
Load the selected net and its driver instance to the Cone window. |
Ctrl+N |
|
Append the selected object(s) to the Cone window. |
Ctrl+Shift+L |
|
Append the selected net and its driver instance to the Cone window. |
Ctrl+Shift+N |
|
Load a flat view of the selected hierarchical instance into the Cone window (similar to the Complete Hierarchy function). |
||
This is a shortcut to the often used features of the Cone Extraction dialog to append the paths to clocked cells respectively top-level I/O ports. |
||
Show the Cone Extraction dialog window. |
||
Show a dialog with additional information for the current selection. This includes also information about bus members of a bus. |
Ctrl+I |
|
Show timing information for the current selection. |
Ctrl+Shift+I |
|
The Connectivity Browser helps to examine a Net on the module level or a Signal (all interconnected nets as they pass hierarchy borders). There are functions to browse the connected pins and to display some or all connections in the Cone window. |
||
The Edit submenu provides functions to edit or add attributes to an object. |
||
Add comments to any object. |
Ctrl+O |
|
Populate the contents of this module from the binfile. |
||
Insert objects from the clipboard into the Mem window. |
Ctrl+V |
|
Remove the selected object(s) from the window. |
Del |
|
Clear the window (remove all objects from the window). |
Ctrl+Del |
|
Remove objects ids that are now invalid (e.g. after the database has changed). |
Shift+Del |
|
Select all objects. |
Ctrl+A |
|
Deselect all objects. |
Esc |
|
Save the contents to an ASCII file. |
Ctrl+S |
|
Depending on the selected object type this entry converts net to signal or instance to module/primitive and vice versa. |
The Search Popup Menu
The picture shows the context menu of the Search window.
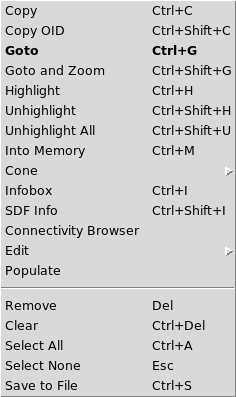
The following table describes all commands accessible from the Context Menu of the Search window. The invoked command runs on the selected object(s). Multiple selection with Ctrl and left mouse button is possible before pressing the right mouse button.
| Popup Item (Search) | Description | Keyboard |
|---|---|---|
Copy the name(s) of the selected object(s) to the clipboard. |
Ctrl+C |
|
Copy the Object ID(s) of the selected object(s) to the clipboard. |
Ctrl+Shift+C |
|
Goto the selected object(s) in each window. Each window will temporarily highlight the object(s) with the Goto color (the next mouse selection will remove the "Goto color"). |
Ctrl+G |
|
Goto and zoom to the selected object(s) in each window. |
Ctrl+Shift+G |
|
Highlight the selected object(s) with the current highlight color (0 to 15). The current highlight color is selected from the main menu or the toolbar. |
Ctrl+H |
|
Unhighlight the selected object(s). |
Ctrl+Shift+H |
|
Unhighlight all highlighted object(s) and remove all highlight information. |
Ctrl+Shift+U |
|
Add the selected object(s) into the Mem window. |
Ctrl+M |
|
The "Cone" sub-menu provides functions to add objects to the Cone window. |
||
Load the selected object(s) to the Cone window. |
Ctrl+L |
|
Load the selected net and its driver instance to the Cone window. |
Ctrl+N |
|
Append the selected object(s) to the Cone window. |
Ctrl+Shift+L |
|
Append the selected net and its driver instance to the Cone window. |
Ctrl+Shift+N |
|
Load a flat view of the selected hierarchical instance into the Cone window (similar to the Complete Hierarchy function). |
||
This is a shortcut to the often used features of the Cone Extraction dialog to append the paths to clocked cells respectively top-level I/O ports. |
||
Show the Cone Extraction dialog window. |
||
Show a dialog with additional information for the current selection. This includes also information about bus members of a bus. |
Ctrl+I |
|
Show timing information for the current selection. |
Ctrl+Shift+I |
|
The Connectivity Browser helps to examine a Net on the module level or a Signal (all interconnected nets as they pass hierarchy borders). There are functions to browse the connected pins and to display some or all connections in the Cone window. |
||
The Edit submenu provides functions to edit or add attributes to an object. |
||
Add comments to any object. |
Ctrl+O |
|
Populate the contents of this module from the binfile. |
||
Remove the selected object(s) from the window. |
Del |
|
Clear the window (remove all objects from the window). |
Ctrl+Del |
|
Select all objects. |
Ctrl+A |
|
Deselect all objects. |
Esc |
|
Save the contents to an ASCII file. |
Ctrl+S |
The Wave Popup Menu
The picture shows the context menu of the Wave window.
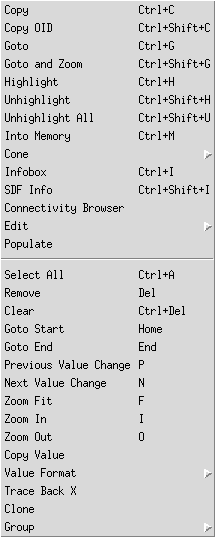
The following table describes all commands accessible from the Context Menu of the Wave window. The invoked command runs on the selected object(s). Multiple selection with Ctrl and left mouse button is possible before pressing the right mouse button.
| Popup Item (Wave) | Description | Keyboard |
|---|---|---|
Copy the name(s) of the selected object(s) to the clipboard. |
Ctrl+C |
|
Copy the Object ID(s) of the selected object(s) to the clipboard. |
Ctrl+Shift+C |
|
Goto the selected object(s) in each window. Each window will temporarily highlight the object(s) with the Goto color (the next mouse selection will remove the "Goto color"). |
Ctrl+G |
|
Goto and zoom to the selected object(s) in each window. |
Ctrl+Shift+G |
|
Highlight the selected object(s) with the current highlight color (0 to 15). The current highlight color is selected from the main menu or the toolbar. |
Ctrl+H |
|
Unhighlight the selected object(s). |
Ctrl+Shift+H |
|
Unhighlight all highlighted object(s) and remove all highlight information. |
Ctrl+Shift+U |
|
Add the selected object(s) into the Mem window. |
Ctrl+M |
|
The "Cone" sub-menu provides functions to add objects to the Cone window. |
||
Load the selected object(s) to the Cone window. |
Ctrl+L |
|
Load the selected net and its driver instance to the Cone window. |
Ctrl+N |
|
Append the selected object(s) to the Cone window. |
Ctrl+Shift+L |
|
Append the selected net and its driver instance to the Cone window. |
Ctrl+Shift+N |
|
Load a flat view of the selected hierarchical instance into the Cone window (similar to the Complete Hierarchy function). |
||
This is a shortcut to the often used features of the Cone Extraction dialog to append the paths to clocked cells respectively top-level I/O ports. |
||
Show the Cone Extraction dialog window. |
||
Show a dialog with additional information for the current selection. This includes also information about bus members of a bus. |
Ctrl+I |
|
Show timing information for the current selection. |
Ctrl+Shift+I |
|
The Connectivity Browser helps to examine a Net on the module level or a Signal (all interconnected nets as they pass hierarchy borders). There are functions to browse the connected pins and to display some or all connections in the Cone window. |
||
The Edit submenu provides functions to edit or add attributes to an object. |
||
Add comments to any object. |
Ctrl+O |
|
Populate the contents of this module from the binfile. |
||
Select all signals. |
Ctrl+A |
|
Remove the selected signal(s) from the Waveview window. |
Del |
|
Clear the Waveview window (remove all signals). |
Ctrl+Del |
|
Jump to the start time. |
Home |
|
Jump to the end time. |
End |
|
Jump to the previous value change of the selected signal(s). |
P |
|
Jump to the next value change of the selected signal(s). |
N |
|
Zoom fit to show all value changes. |
F |
|
Zoom in. |
I |
|
Zoom out. |
O |
|
Copy the signal value at the time marker to the clipboard. |
||
The "Value Format" sub-menu provides commands to change the displayed format of the bus value only for the selected signal(s). |
||
Display bus values in hexadecimal format. |
||
Display bus values in decimal format. |
||
Display bus values in binary format. |
||
Display bus values in octal format. |
||
Find the source of the selected X value. |
||
Clone selected variables. |
||
The "Group" sub-menu provides grouping related functions. |
||
Create a new group containing the selected signals (and keep the signals loaded). |
||
Create a new group containing the selected signals (and remove the signals). |
||
Change the name of a group. |
Toolbar
The toolbar shows several icons as shortcuts to commonly used commands (most of them are also available in the main menu).

-

 Toggle the Signal Mode. If Signal Mode is enabled then all selected net objects will be converted to signal objects (list of interconnected nets through the hierarchy).
 -
 The Last Selection label always displays the last recently selected object(s). It displays the type and the name of the object. If more than one object is selected, then the number of additional selected objects is displayed in parenthesis.


Open Input Files Dialog
This chapter describes the Open Input Files dialog window which is the GUI to all parsers shipped with GateVision PRO. It also explains how to add design files and configure the parsers. The "Open Files" dialog can be opened from the File > Open menu or by the corresponding icon in the toolbar.
Supported Input File Types
GateVision PRO is shipped with parsers to read the following file types:
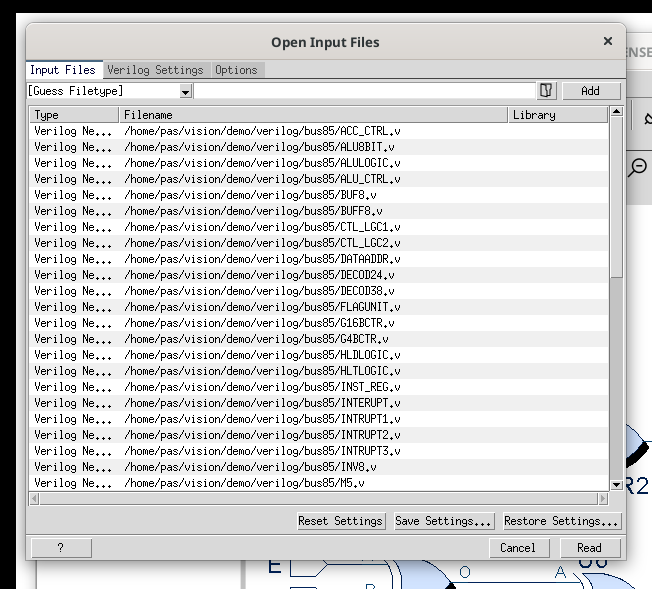
Add Design Files
The Input Files tab provides an interface to select various design files for compilation. This can be a mix of Netlist Files and Library Files.
To add a new file, press the  button and choose an input file.
The file type is guessed based on the extension.
The Add button can be used to add a manually entered file to the input file table.
button and choose an input file.
The file type is guessed based on the extension.
The Add button can be used to add a manually entered file to the input file table.
The table on the Input Files tab shows all added design files, their types and the names of their compilation libraries (for netlist files the library name is always "work").
To delete a file, select the row in the input file table and press the Delete key on your keyboard. To delete all files at a time, the Ctrl+Delete key can be used.
To change a file’s type or compilation library, you can double click on the corresponding column of the row in the input file table to enter the edit mode.
The Save Settings and Restore Settings buttons at the bottom of the dialog can be used to save and restore all settings from the Open Input Files dialog.
The Reset Settings button sets all values back to their built-in defaults and also clears the input file table.
The Read button will start the parser on all selected input files.
Netlist Files
GateVision PRO provides netlist parsers for structural Verilog, EDIF 2.0.0 and DEF files.
Verilog
The Verilog netlist parser of GateVision PRO is optimized to read huge netlists fast and memory efficient. Therefore only the structural subset of "Verilog 95" is supported.
All instantiated cells must be defined either as Verilog "modules" or "primitives", however, a declare-before-use restriction does not apply. This means, it’s ok for the Verilog Parser to find the cell definitions just anywhere in the Verilog design or Library files. But all library cells must be defined in Verilog. Specifying symbol shapes (e.g. with Symlib) is not sufficient.
If Verilog libraries are missing, then the Verilog parser gets "undefined instances" and tries to guess the footprints of the missing cells. However, for Verilog instantiation by order, the library cell’s port names cannot be guessed. They are created with "undefined" direction. In general, missing Verilog library cells result in bad looking schematics - even if symbol shapes are specified (as mentioned above).
EDIF
The EDIF parser of GateVision PRO can read EDIF 2.0.0 files and extract the netlist information. All EDIF schematic elements will be silently ignored.
DEF
A DEF file is usually read in combination with the corresponding LEF file. A DEF file contains the structure and the layout of a design. The DEF parser of GateVision PRO extracts only the netlist information to display a schematic of the design data contained in the DEF file.
Library Files
Liberty
A Liberty file can be used to provide library information for e.g. the Verilog netlist parser. The interface port directions are extracted from the Liberty file as well as the function of the output port(s). Based on the Boolean equation of the function a gate symbol shape is generated.
LEF
A LEF file is usually used in combination with the corresponding DEF file. A LEF file contains the interface definition and the layout of a cell. The LEF parser of GateVision PRO extracts only the interface information and ignores all layout information.
Symlib
A "Symbol Library" file only defines the symbol shapes in the schematic. The interface definition is not extracted and needs to be defined either in the input file or any other library format. Enable the "Preload a symbol library file" option to read the symbol library files before the netlist.
Import Verilog Fileset
For your convenience, a Verilog XL fileset can be imported into GateVision PRO. The input files, include directories, library settings and macro definitions are distributed into the corresponding fields of this dialog.
Verilog Specific Settings
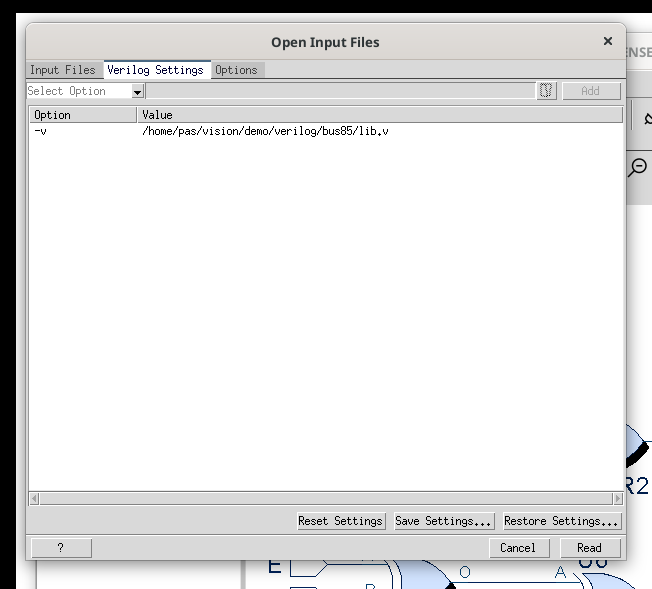
The Verilog Settings tab allows you to add include directories, add Verilog library files, specify a library search path and a library file extension. Also Verilog macros can be defined in this tab.
To add an option select the corresponding entry in the Select Option combobox and browse for a file or add a value.
Options to Configure the Parsers
The Options tab allows you to define various parser settings. All options can also be specified on the command line.
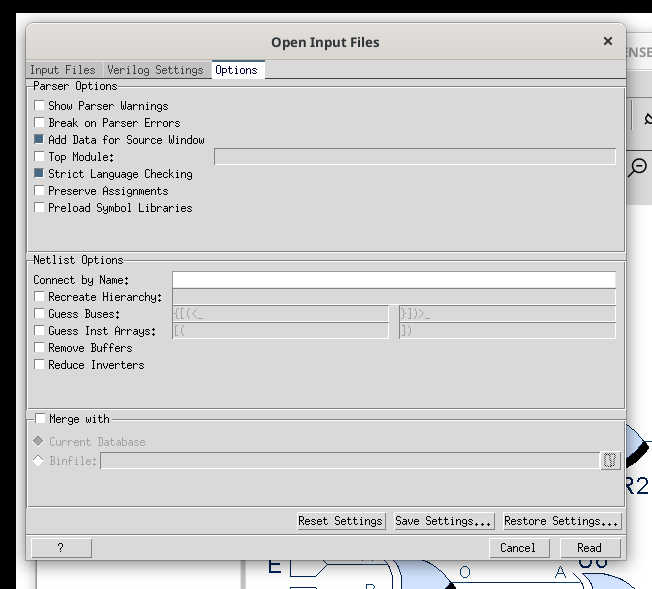
General Parser Options
-
Show Parser Warnings - Displays parser warnings in the Console window.
-
Break on Parser Errors - Stop the parser if an error occurs.
-
Add Data for Source window - Controls if additional source file cross-reference information is created (switching off saves some memory but disables the Source window).
-
Top Module - Enter a new top-level module name. The parser removes all modules not inside the instantiation tree below the given design top module.
-
Strict Language Checking - Degrade selected errors into warnings and warnings into info messages.
-
Preserve Assignments - Preserve every assignment in the schematic.
-
Preload Symbol Libraries - Load symbol library files before the netlist.
Netlist Options
-
Connect by Name - Space separated list of net name patterns. Matching nets are connected by name, i.e. they are not routed in the schematic view.
-
Recreate Hierarchy - Split instance names of a flat design at the given hierarchy separator character and re-create the design hierarchy.
-
Guess Buses - Guesses module port and net buses. The two entries contain open/close bit subscript delimiter characters. Close may be empty. For the special case that open contains
0, no character between base name and bit subscript is needed. -
Guess Inst Arrays - Guesses instance arrays. The two entries contain open/close subscript delimiter characters. The close field can be empty to support only one separator character between the name and the bit subscript. For the special case that open contains
0, no character between base name and the subscript is needed. -
Remove Buffers - Remove all BUF and WIDE_BUF instances and merge the connected nets.
-
Reduce Inverters - Replace odd number of INVs in a chain by one INV and remove an even number of INVs in a chain.
Merge Design Data
The 'Merge with' option allows you to merge the selected design files either with the Current Database or with a previously saved Binfile.
Command Line Options
The command line options of GateVision PRO are:
| Option | Parameters | Description |
|---|---|---|
|
Read cmdline arguments from file. |
|
|
Open a zdb binfile. |
|
|
Open this binfile as a precompiled library. |
|
|
Stop on errors during parsing. |
|
Don’t read workspace file from home directory. |
||
Check the availability of the license. |
||
|
Connect matching net by name, i.e. don’t route it. |
|
|
Create buses for ports with Verilog conform, consecutive numbering. |
|
|
Create hierarchy from flat instance names. Split the instance names at the given hierarchy separator. If the given hierarchy separator character is an empty string then the hierarchy separator character is guessed. |
|
|
Create vectors based on scalar names. |
|
|
Enable a specific debug flag. |
|
Read the input file as a DEF file. |
||
|
Define a Verilog macro on the command line. |
|
|
Define Verilog macros on the command line. |
|
Don’t read history file from home directory. |
||
|
The name of the X server to use. |
|
|
Set drag & drop mouse button. |
|
Read the input file as an EDIF netlist. |
||
End of library files, design follows. |
||
|
Read Verilog fileset file. The files in the fileset are relative to the fileset file. |
|
|
Read Verilog fileset file. Files in the fileset are relative to the current working directory. |
|
Display main window in fullscreen mode. |
||
|
Specify the initial geometry for main window using the format WIDTHxHEIGHT+XPOS+YPOS. |
|
|
Define global Verilog include files. Global includes are processed before any other source files (this option can be repeated multiple times). |
|
|
Guess buses based on net and port names with a bit subscript enclosed in the given 'open' and 'close' characters. |
|
|
Guess instance arrays based on instance names with a bit subscript enclosed in the given 'open' and 'close' characters. |
|
Print a help text with a short description of each option. |
||
|
Set the desired hierarchy separator 'hiersepchar' of your choice. Any character can be used. To be able to identify the hierarchy separator, a character that is not already used in an identifier should be used. |
|
Start the main window iconified. |
||
|
Case-insensitive parser. |
|
|
Define an include directory (this option can be repeated multiple times). |
|
|
Define include directories. |
|
|
Level of verbosity for issued messages. |
|
|
Use this initial directory for the file dialog. |
|
Read the input file as a LEF file. |
||
Read the input files as a Liberty library. |
||
|
Define the file name extensions for the -y option. |
|
|
Generate log file. |
|
|
Specify a MXD file. |
|
|
The scope name of the design under test. |
|
|
The scope path which needs to be removed before before the remaining path will be matched against the design. The first name of the remaining scope path will be matched against top module names of the design. If there is only one top module the scope name need not to match |
|
|
Toggle pedantic language checking mode (in relaxed mode some errors are just warnings and some warnings are suppressed). |
|
|
Specify plugin directory. |
|
|
Preserve assignments in the netlist. |
|
Enable profiling of the GUI and ZDB API. |
||
|
Use options from the given project. |
|
Open a zdb binfile in quick mode. |
||
|
Replace odd number of INVs in a chain by one INV and remove an even number of INVs in a chain. |
|
|
Remove all BUF and WIDE_BUF instances and merge the connected nets. |
|
|
Resolve duplicate cells. If "off" all duplicate cells are renamed. |
|
|
Specify a SDF file to attach. |
|
|
Specify the name of the design under test. |
|
|
Create source code references. |
|
Preload symbol library file(s) given with the -symlib option. |
||
|
Specify a symbol library file. |
|
|
Define SystemVerilog file name extensions. |
|
|
Specify a directory for temporary files. |
|
Print CPU time consumption (requires enabled progress updates). |
||
|
Display the given toolname in the titlebar. |
|
|
Define this module as the top module. If * is set, then all unreferenced cells are used as top. |
|
|
Load Userware (source a Tcl file). |
|
|
Load Userware with one argument in argv. |
|
|
Load Userware with 2 arguments in argv. |
|
|
Load Userware with a list of arguments in argv. On the command line the list needs to be one quoted argument which will be expanded before it is passed to the specified Userware script. |
|
|
Evaluate Userware following in next argument. On the command line the list needs to be one quoted argument which will be evaluated as a Userware script. |
|
|
Read <libfile> as Verilog library file. |
|
|
Specify a VCD file. |
|
Read Verilog netlist. |
||
|
Define Verilog 1995 file name extensions. |
|
|
Define Verilog 2001 file name extensions. |
|
Print the tool version. |
||
|
Wait 'sec' seconds for a license. If the value is -1 then the started tool will not wait for the next free license. Use a value of 0 to wait forever. |
|
|
Specify a WDB file. |
|
|
Use options from the given workspace. |
|
|
Read files matching the extension given with +libext+ from the specified directory as Verilog library files. |
Pane Window
The Pane window is a container for a Tab group. In the built-in default GUI layout there are only two Pane windows. Additional Pane windows can be created on demand using the split icons in the tab pane. From the Window menu new toplevel Pane windows can be created.
Tab Group


Click on the tab’s name to bring its window to the front (activate it).
Additional tabs can be added using the special "+" tab.
The Tree Window
The Tree window displays the design hierarchy.
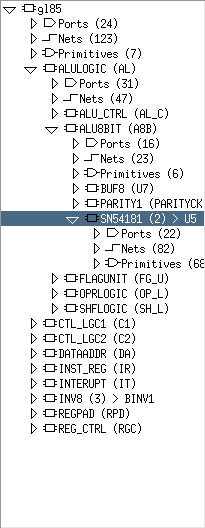
The Tree widget supports two different view types.
The module based view show a folded tree sorted and grouped by modules. Modules that are instantiated several times display only one instance, i.e. the hierarchy tree is "folded". Such modules have a small left to right arrow to indicate that it is instantiated multiple times.
To open the module’s instantiation list click on the down-arrow at the end of the line. To select one specific instance, click on the instance name in the drop down list.
The instance based view show each module instance and sort the tree by instance names.
Each tree node of a hierarchical module instance in the tree can contain up to six sub-entries to group the module contents.
The "Ports" and "Nets" entries allow for quick access to all ports, portBuses, nets and netBuses.
The "Primitives", "Registers" and "Operators" entries group primitive instances by its function and type.
Instances can be grouped in a user defined custom group by flagging instances with the group flag.
Modules with parameters have an additional entry "Parameters" which lists the parameters and their respective values.
The default action in the context menu of the tree is Current Module, i.e. if you double-click on a module in the tree, it will become the 'current module' and it will be loaded and displayed in the Schem window. The Schem window’s tab will be activated, if not already open.
The Memory Window
The Mem window can be used as a notepad.
You can Drag & Drop any object to and from the Mem window.
Objects that are currently highlighted will be displayed in the corresponding highlight color.
Invalid entries, i.e. those who cannot be matched to a valid OID in the current database are grey and disabled.
The picture above shows a Mem window that contains 9 valid objects, 3 of them are highlighted in different colors.
The default action of the context menu in this window is Goto, i.e. the selected object is temporarily highlighted in each window (the 'current module' as displayed in the Tree window may change).
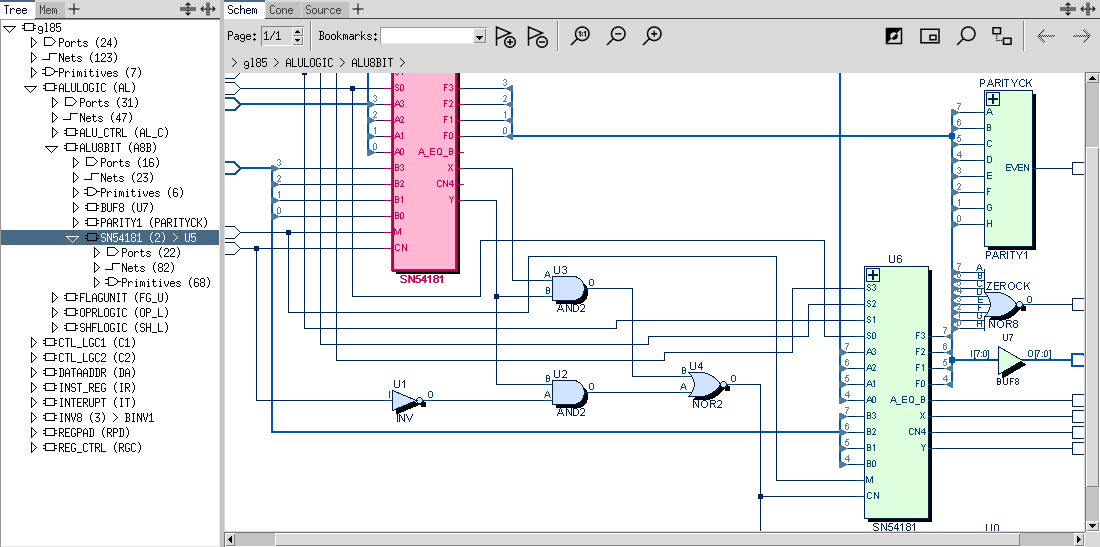
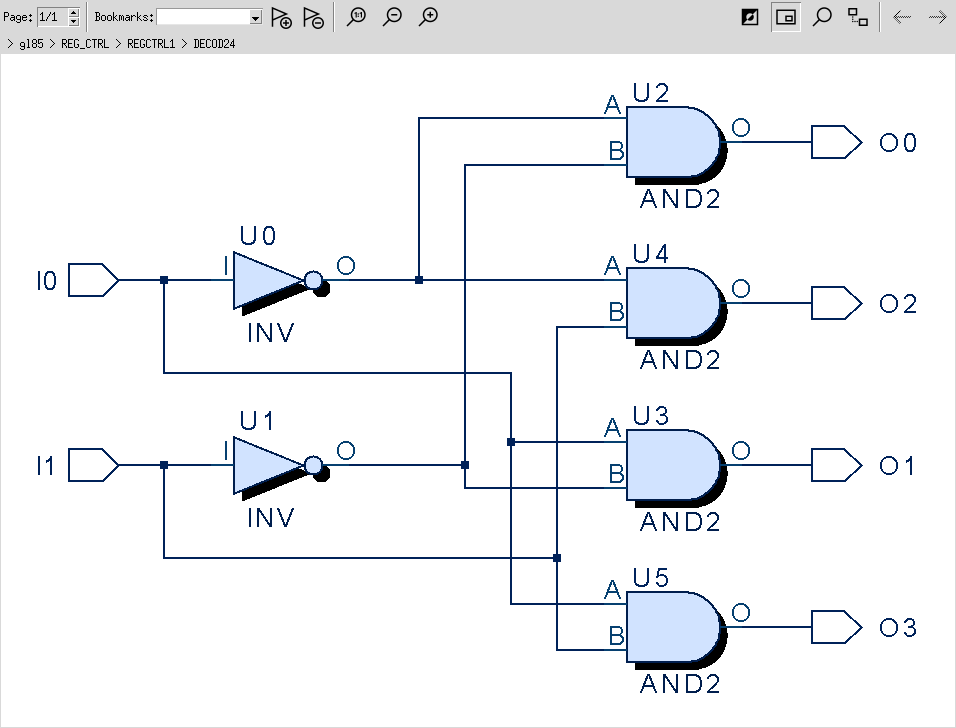
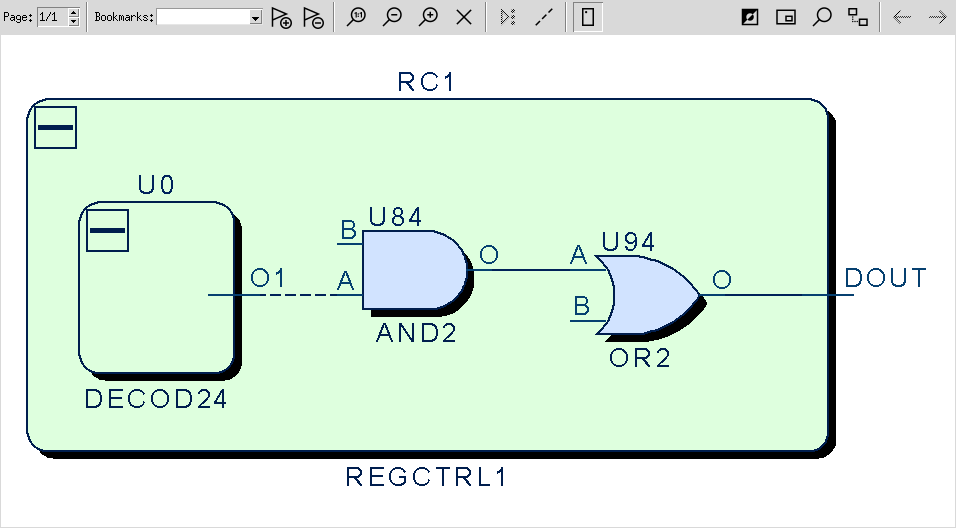
The Schematic Window
The Schem window displays a complete module (split into pages).
The Bookmark feature in the toolbar can be used to save/restore the current schematic view. The default name of a bookmark (created using an unique number and the module name) can be changed.
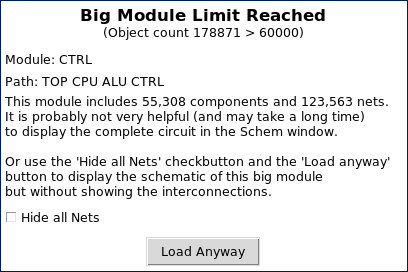
If the module is larger than the page size you selected in Preferences it must be split into different pages. Splitting is done automatically. See below, how to change between the different pages. If the module to be displayed exceeds the limit set in Preferences, a dialog box is presented.
The Schem window and Cone window have many functions in common. The table below explains some of the common features and later the Schem window specific part.
The stroke mouse button depends on the setting of the Drag & Drop mouse button. It is always the opposite, e.g. if Drag & Drop is bound to the right mouse button, then the strokes are bound to the left mouse button and vice versa.
| Action | Info | Keyboard(*) |
|---|---|---|
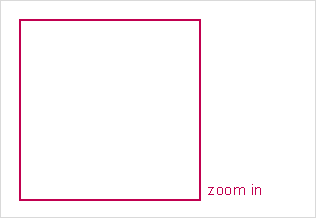
Use the stroke mouse button to drag a rectangular (zoom) area.
Start dragging from top left corner and stop dragging in the bottom right corner of the area to be zoomed in. |
I |
|
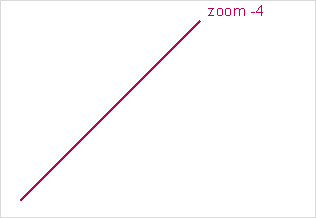
Use the stroke mouse button to drag a line in top right direction.
The longer the line the higher the zoom-out factor will be.
You can see the zoom factor while dragging; minimum zoom factor is 0.5, maximum is 3. |
O |
|
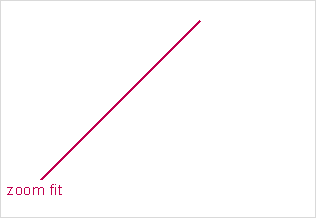
Use the stroke mouse button to drag a line in bottom left direction. The schematic will be zoomed to fit completely into the current window. The zoom factor is automatically adjusted whenever the window size changes. |
F |
|
accessible via context menu - it will regenerate the displayed module or schematic excerpt. |
Shift+R |
|
accessible via context menu - optimize the displayed module: keep the placement of ports and instances, but optimizes the net routing. |
Shift+O |
|
Single-click any visible object in the window with the left mouse button. Selected objects have a thicker borderline. |
none |
|
Keep the Ctrl-key pressed while single-clicking any visible object in the window with the left mouse button. If the object was already selected, it will become deselected. |
none |
|
select multiple objects |
Keep the Shift-key pressed while dragging the mouse with the stroke mouse button pressed down to open a rectangular area. |
none |
highlight |
accessible via context menu - it will highlight the current selection. |
Ctrl+H |
unhighlight |
accessible via context menu - it will unhighlight the current selection. |
Ctrl+Shift+H |
If there are multiple schematic pages then a spinbox appears in the top left corner of the window. The up and down buttons allow you to navigate to the previous and next schematic page. A label left to the buttons shows the current page and the total number of pages. A click into the page field opens a listbox to provide fast access to each page. |
PageUp PageDown |
|
The Greymode icon will toggle "greymode". The complete displayed schematic will be grayed out, except for the highlighted components. |
none |
|
The Minimap icon will toggle the visibility of a Minimap window in the bottom right corner. Once the Minimap window is visible it can be moved within the window. |
none |
|
The Magnify icon will toggle the visibility of a Magnify window in the bottom left corner. Once the Magnify window is visible it can be moved within the window. |
none |
|
Keep the Ctrl-key pressed while dragging the mouse in any direction with stroke mouse button (opposite of the Drag & Drop button) pressed down to move one or more components (inst, port, portBus or page connectors) or a net object (net or netBundle) to a new location and update the net routing.
For net objects only the y position inside the component column (level) can be changed.
Multiple components can be dragged by selecting them first and then start dragging at one of the selected components.
A draft version of the moved component(s) is drawn while being moved.
The echo of the component’s symbol shape identifies that the target location is valid. |
none |
|
Schem window specific functions |
||
Use the stroke mouse button to drag a line in top left direction. The instance we are coming from will be selected in Schem window. |
none |
|
hierarchy down (default) |
A double-click on a hierarchical (non-primitive) instance will load its down-module in the Schem window. |
none |
The Nethide icon will toggle the hide flag at all displayed nets. Hidden nets are not routed through the schematic page but only displayed as stubs (with a dot at the end) at all connected pins, which allows to select the net object. Each selected hidden net is drawn with a zigzag path to all connected pins. A double click on a stub displays and routes the net. A double click on a displayed net will set the hide flag and the net disappears from the schematic view. |
none |
|


|
Note
|
For the keyboard shortcuts to work properly, the Schem window must have the focus. Use the Tab-key to change the focus or click into the Schem window to transfer the focus. |
Connectivity Lens
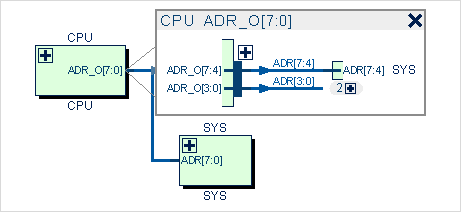
The Connectivity Lens is an inline window accessible from the Popup menu of the Schem or Cone window to display detailed connectivity information for the selected pin or port. There can only be one Connectivity Lens window on a schematic page.
If the selected object is a bus then all single-bit connections (from the msb to lsb) are listed, while grouping adjacent pins into sub-buses if that is possible without any ambiguity.
One condition for this grouping is that the adjacent pins can form a regular bus name.
For example, A[3], A[2] and A[1] qualify to form the regular bus name A[3:1].
Small triangles indicate the logical signal flow direction from the driver (e.g. output pin) to its receiver (e.g. input pin).
The Cone Window
The Cone window displays schematic excerpts (paths, cones, etc.) and is used for Incremental Schematic Navigation.
Its behavior is pretty much the same as the Schem window but it allows for interactive incremental disclosure of the schematic, even across hierarchy borders (giving a kind of "flat-view" on the database).
The Bookmark feature in the toolbar can be used to save/restore the current view of the Cone window. The default name of a bookmark (created using the term Bookmark followed by an unique number) can be changed. In addition the Cone window provides a second, file based, snapshot mechanism accessible through the Popup menu.
The following table explains the functions that only apply to the Cone window. For general functions like, e.g. zoom, selection or highlighting, see the table in the Schem window section.
| Action | Info | Keyboard(*) |
|---|---|---|
Cone window specific functions |
||
add objects |
To add a component into the Cone window, use the Drag & Drop feature. You can drop any valid database object into the Cone window. Dropping one or more database objects, will cause it to be loaded (if not already visible) and centered under the mouse cursor. Dropping pins will cause the corresponding instance to be loaded. |
none |
remove objects |
To delete one or more components from the Cone window, select it and choose 'Remove' from the context menu. Deleting instances that contain other objects cause them to be removed, too. |
Del |
remove all objects |
To delete all components from the Cone window, choose 'Clear' from the context menu. |
Ctrl+Del |
To incrementally extend the schematic excerpt, double-click with the left mouse button on any component you see in Cone window: Nets & NetBuses are displayed in dashed style to indicate that they are not completely loaded; "more" will load more components connecting to that Net/NetBus until the Net is complete. It then turns into solid-style. Ports & PortBuses as well as Pins & PinBuses can also be double-clicked on. It causes the corresponding net(s) to be loaded or extended (see item above), if it is already loaded. PinBuses & PortBuses can be double-clicked on with Ctrl-key pressed. A small dialog pops up that allows you to select the subpin or subport. Pins & Nets can also be double-clicked on with Ctrl-key pressed. A small dialog pops up that allows you to select the component to load. Also all connected components can be loaded. |
none |
|
Double-click with the left mouse button on the border of an instance to turn the autohide feature 'on'. Autohide causes (temporarily and permanently) unconnected instance pins to be hidden automatically (until they are connected to a 'loaded', i.e. visible, net). Alternatively, you may also set the 'Hide Unconnected Pins' option either in the toolbar of the Cone window or in the Cone tab of the Preferences dialog. |
none |
|
autohide off |
Double-click with the left mouse button on the border of an instance to turn the autohide feature 'off'. |
none |
The content of the selected hierarchy boxes is hidden thus the boxes look empty.
This can be quite useful after a cone extraction to reduce the amount of details displayed in cone. |
Ctrl+F |
|
unfold |
The content of the selected folded hierarchy boxes is shown again. |
Ctrl+U |
If a pin or port is selected in the Cone window, the Extract to Driver/Load button in the toolbar lets you quickly extract the cone towards the driver/towards the loads. Note that the toolbar button changes its icon depending on whether an input or an output port/pin is selected. |
none |
|
Expand Nets |
Expand all partially loaded nets and netBuses (which are shown with dashed lines). |
none |
The Nethide icon will toggle the hide flag at all displayed nets. Hidden nets are not routed through the schematic page but only displayed as stubs (with a dot at the end) at all connected pins, which allows to select the net object. Each selected hidden net is drawn with a zigzag path to all connected pins. A double click on a stub displays and routes the net. |
none |
|
If the "Remember History" check-button is enabled then the two buttons in the top right corner of the Cone window allow you to move back and forward in the history of the Cone window. |
none |
|
The Bookmark feature allows to save the current Cone window content as a Cone bookmark and restore it afterwards. |
Ctrl+D |
|
The Snapshot feature allows to save the current Cone window content as a Cone snapshot and restore it afterwards.
Snapshots are saved to files that can later be loaded or manually copied to another machine for review (even without the design database loaded).
The context menu has a separate sub-menu (called 'Snapshot') for the snapshot functions save and open. |
Ctrl+S |
|
Save Cone as Verilog |
The contents of the Cone window is saved as a Verilog netlist. |
Ctrl+Shift+S |


Cone Extraction Dialog
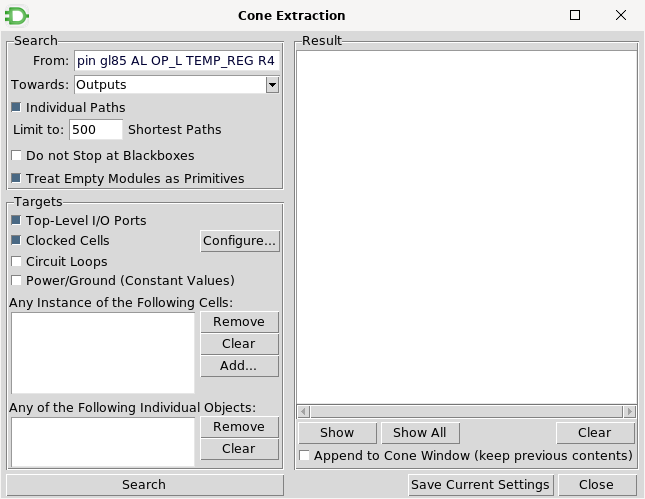
The Cone Extraction dialog is accessible either through the Tools main menu () or the context menu of the Cone window. If invoked from the Popup menu then the selected object is used as the start point. Drag & Drop can also be used to define the start object.
Using the Cone Extraction dialog, you can search for all paths from the given start point to all reachable targets either towards the inputs or towards the outputs.
[extract:dir]
If the option Individual Paths is enabled, the search result is returned as a list of individual paths, if the option is disabled, the complete cone is returned, which is a summary of all paths.
[extract:path]
[extract:pathLimit]
Usually a blackbox instance is a stop cell.
If the option "Do not Stop at Blackbox" is enabled then all unknown pins are treated as bidirectional and the extraction goes through the cell in all directions.
[extract:unknown2IO]
The cone extraction would stop at empty modules, because there is no path through the module.
With the option "Treat Empty Modules as Primitives", an empty module can be treated as a primitive and the extraction will not dive into it, but continue at all pins of the module instance.
[extract:emptyModAsPrim]
The cone extraction can stop at the following targets:
-
Top-Level I/O Ports - run the extraction to all top-level I/O ports.
[extract:targetIO] -
Clocked Cells - stop at all clocked cells.
[extract:clkCell] -
Circuit Loops - stop at a loop in the circuit.
[extract:targetLoop] -
Power/Ground (Constant Values) - stop at supply nets or nets with a constant value.
[extract:targetPGNet] -
Any Instance of the Following Cells - all instances of the specified cells are targets. Use Drag & Drop to specify a list of cell names.
[extract:targetCells] -
Any of the Following Individual Object - a specific object is the target. Use Drag & Drop to specify a list of possible target objects.
[extract:targetOIDs]
The search result is shown in the Result list of this dialog.
The list of paths is sorted by path depth (the shortest path is the first).
A double click in the result list loads the path or cone to the Cone window.
Use the "Append to Cone Window" option to keep the previous contents in the Cone window loaded.
[extract:appendResult]
Using Drag & Drop always appends a path to the Cone window.
Save Cone
Save Cone as Verilog
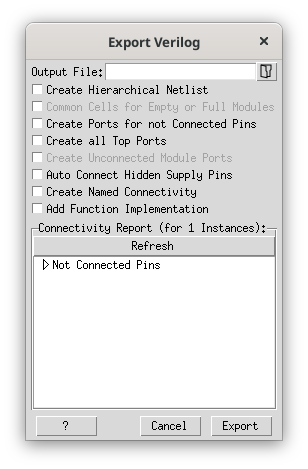
The contents of the Cone window can be saved as a Verilog file. The Save Cone as Verilog feature is available either through the Tools main menu () or the context menu of the Cone window.
In a dialog window similar to the image above, you get a detailed Connectivity Report of the Cone fragment you want to export. You can drag objects from the report window to the Cone window. In the Cone window the object is highlighted using the goto color.
If you are satisfied with the report, then enter a filename and press the Export button to save the contents of the Cone window as a Verilog netlist.
If the option "Create Hierarchical Netlist" is enabled, a hierarchical Verilog netlist will be created.
The option "Common Cells for Empty or Full Modules" controls whether modules are instantiated multiple times or not.
The option "Create Ports for not Connected Pins" will add an extra level of hierarchy with interface ports for all not connected pins in the top hierarchy. This extra module is instantiated in the design top.
The option "Create all Top Ports" will create all top-level I/O ports of the design top regardless of the visibility in the Cone window.
The option "Create Unconnected Module Ports" will create all module ports visible in the Cone window even if they are not connected.
The option "Auto Connect Hidden Supply Pins" will automatically connect all supply pins that are hidden and thus not displayed in the Cone.
If the option "Create Named Connectivity" is enabled then named connectivity will be created in the generated Verilog netlist. Otherwise implicit connectivity will be created.
If the option "Add Function Implementation" is enabled then the primitive function of cells with a known function is implemented (this can be used by a synthesis tool or to run a simulation).
Source Window
The Source window displays the source code of the input files used to generate the schematic.
The screenshot shows an example source file loaded in the Source window; several objects have been highlighted.
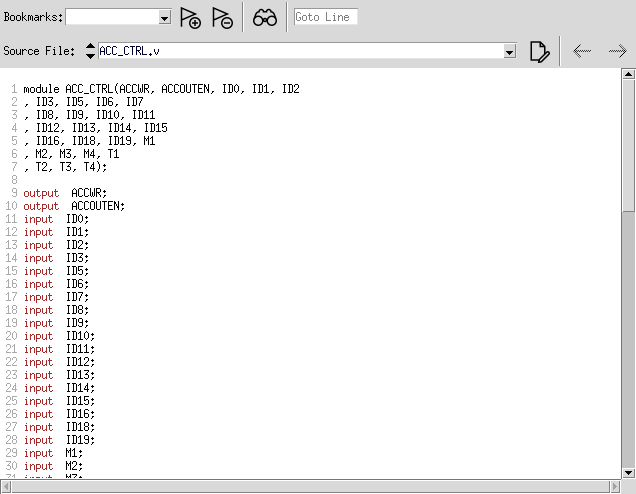
Highlighting
All highlighted objects will be displayed in their corresponding highlight color for easy cross probing.
The Toolbar
The Source window’s toolbar offers several actions:
-
The Bookmark feature can be used to save/restore line positions in the displayed source file. Bookmarked lines are marked with a black flag icon before the line number. The default name of a bookmark (created using the filename and line number) can be changed.
-
The Find in file button opens a panel for incremental text search within the displayed source file and across all files of the current project.
-
Goto line jumps to the entered line number in the current file.
-
The Sourcefile drop-down list shows the currently displayed file and allows for selecting other files to display.
-
The Open Editor button executes an external editor, loads the source file and scrolls to the first line displayed in the Source window. If there is either an object marked by the Goto function or a line marked by "Goto Line" then this information is used as the start line passed to the editor. You may specify the editor in Source tab of Preferences dialog.
-
The history buttons allow for quick navigation to previously visited source file positions.
The Action Bar
If an object is selected in the Source window, the Action Bar opens below the object, offering object specific information and navigation actions.
Depending on the type of selected object, the following information/actions are available:
Modules
-
 goes 'up' to the current instance of the module.
 -
A list of instances.
-
Show goes to the selected instance.
Instances
-
 goes 'down' to the corresponding module.
Ports/Port Buses
-
goes 'up' to the corresponding pin/pin bus.
Pins/Pin Buses
-
goes 'down' to the corresponding port/port bus.
Nets/Net Buses
-
 and
and  go to the previous/next occurrence of the selected net.
 -
 goes to the net’s 'driver'; if multiple drivers exist,
  is shown.
 -
A drop-down list of connected pins/ports; if the object is a 1-to-1 connected net bus, the connected pin buses/port buses are shown; if the object is a ripping net bus, pins/ports connected to the individual bus members are shown.
-
Show goes to the selected pin/port.
Drag & Drop
The Source window supports Drag & Drop: if one or more objects are dropped into the Source window, then the tool will scroll to the closest line number (relative to the currently displayed source file) of any dropped object and selects it. You can also drag objects from the Source window to the other windows (e.g. Schem or Cone window).
The Search Window
The Search window can be used to search the current database for certain components.
The Search window can be opened by clicking the  icon in the toolbar or by selecting from the main menu.
Simple Search Mode
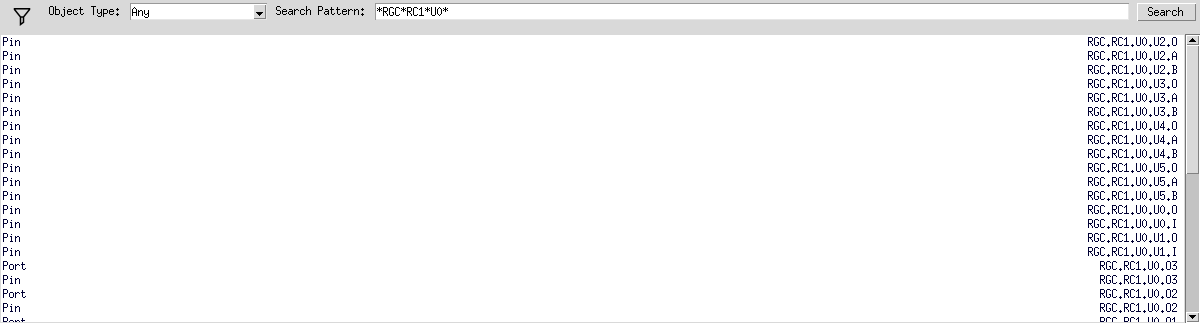
The simple mode of the Search window is composed of a combobox for selecting the Object Type to search for, a text entry field for entering a glob-style search pattern, and a Search button.
[Search:type],
[Search:name]
The Search button (or the Enter key in the search pattern field) starts the search and searches for all database objects matching the entered pattern in all levels of hierarchy.
A long running search may be terminated by clicking the Stop button of the progress dialog.
The result list displays matching objects along with their type.
The default action in the context menu of the result list is Goto, i.e. if you double-click on a result entry and you have the Schem window open, its parent module will become the 'current module' and the result object is selected.
Advanced Search Mode
The Search window also provides an advanced mode that can be activated by clicking on the  icon.
The advanced search allows for a more precise specification of the search parameters and usually results in a better search performance than the "simple mode".
icon.
The advanced search allows for a more precise specification of the search parameters and usually results in a better search performance than the "simple mode".
[Search:advanced]
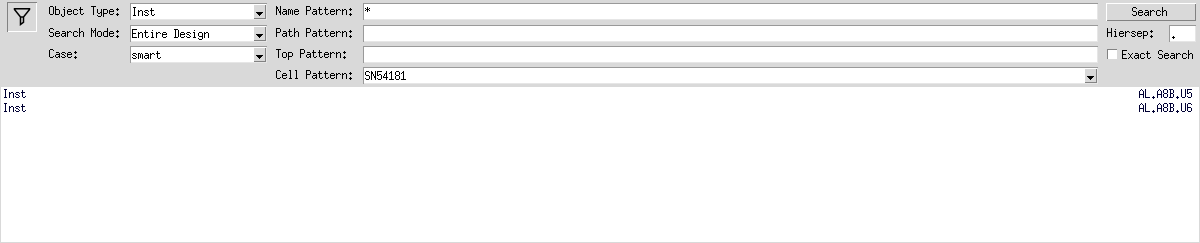
Object Type
As in the "simple search mode", the object type option can be used to restrict the search to specific types of objects.
[Search:type]
Name Pattern
A search pattern for the object’s name.
This does not include the object’s path.
[Search:name]
Search Mode
Path Pattern
A search pattern for the object’s path.
You may drop objects of type "module", "primitive", and "inst" into the entry field to populate it with the path of the dropped object.
[Search:path]
Top Pattern
A search pattern for the object’s top module.
[Search:top]
Hiersep
Specify the hierarchy separation character used in the path pattern, e.g. if the path pattern is top/cpu/adder, use / as the hiersep character.
[Search:hiersep]
Cell Pattern
When searching for instances (⇒ Object Type is Inst or Any), this option restricts the list of reported instances to instances of the specified cell type, e.g. if Cell Pattern is cpu, only instances of the cpu cell are reported.
If you use glob-style patterns (e.g. and*) only instances of cells with a cell name matching this pattern are reported.
When searching for pins/pinbuses (⇒ Object Type is Pin/PinBus or Any), only pins/pinbuses of instances instantiating a matching cell are reported.
When searching for ports/portbuses or nets/netbuses (⇒ Object Type is Port/PortBus/Net/NetBus or Any), only ports/portbuses/nets/netbuses of a matching cell are reported.
You may drop objects of type "module", "primitive", and "inst" into the entry field to populate it with the cell name of the dropped object.
[Search:cname]
Case
-
smart - automatically select case insensitivity if the search pattern contains no uppercase characters. Otherwise search case sensitive.
-
insensitive - ignore upper/lower case of characters in search patterns.
-
sensitive - search case sensitive.
[Search:case]
Exact Search
If this option is enabled, special characters in patterns (*, ?, [, ], …) are interpreted literally instead of being used for glob-style wildcard matching.
[Search:exact]
Wildcards / Glob-Style Patterns
If the Exact Search option is disabled, search patterns are interpreted as glob-style patterns (similar to file name patterns in UNIX shells):
-
*- Matches any sequence of characters including an empty string. -
?- Matches a single character. -
[ABC]- Matches any character in the given set. -
[a-z]matches any character in the rangea-z.
Examples
-
d*matches any string starting withd:d,d1,diode, … -
md[0-9]matchesmd0,md1, …,md9. -
m[A-Z]5matchesmA5,mB5, …,mZ5in case sensitive search mode, it will also matchma5,mb5, …,Ma5,MA5, … in case insensitive search mode.
The Wave Window
The Wave window displays the waveform from a VCD file.
The Waveform viewer can be opened with the  icon in the toolbar or with from the main menu.
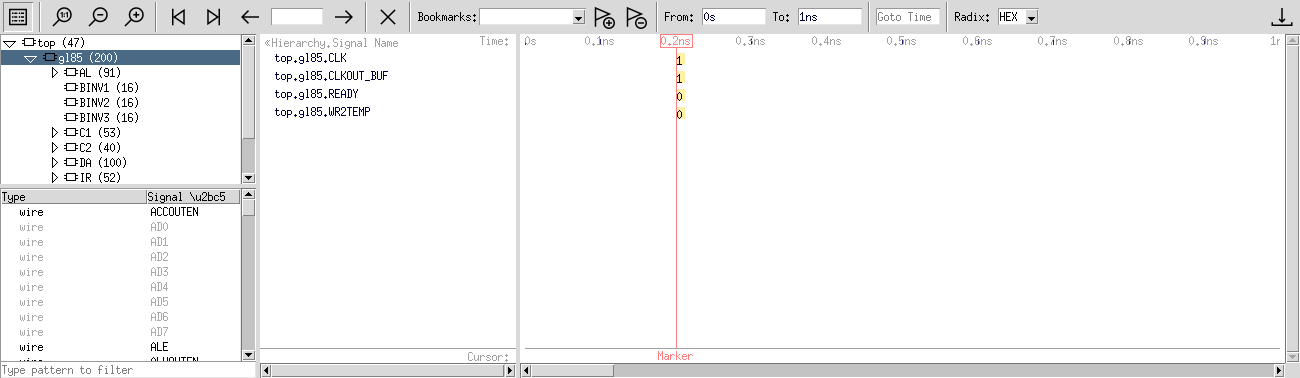
Open Wave Files
Within the Wave window, the open a waveform file  icon can be used to open a VCD or WDB file.
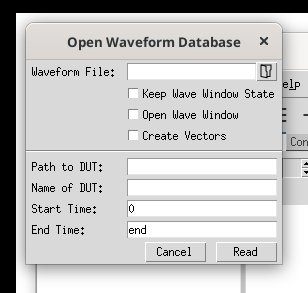
The Open Wave Database dialog has the following options:
-
Waveform File: The waveform database file to open (
.vcdor.wdb). -
Keep Wave Window State: When reloading the previous waveform database file, try to keep the current state of each Wave window (displayed signals, time range, etc.)
-
Open Wave Window: Open the Wave window after reading the file.
-
Create Vectors: Build groups based on scalar names with the same basename and a consecutive bit subscript.
-
Top: Instantiation path to the Design Under Test (DUT).
-
Create Hier: Convert a flat signal name containing the given hierarchy separator into a list of instance names and the signal name.
-
Start Time: Ignore value changes before this time.
-
End Time: Ignore value changes after this time.
Load Signals
The waveforms can be shown either by using Drag&Drop or by double clicking on the signal name in the signal selection window. Signals that could not be matched to the loaded design appear grayed out in the signal selection window. Below the signal selection window there is a search field. Entering a search term here filter all available signal names to the ones containing the search term (case insensitive). The waveform of the grayed out signals can be displayed but these signals cannot be dropped to other views in the GUI.
With this  icon the Waveform window can be cleared.
Signals from an entire module can be displayed by dropping the module name to the Waveform window.
The order of appearance of the signals can be changed with Drag&Drop.
icon the Waveform window can be cleared.
Signals from an entire module can be displayed by dropping the module name to the Waveform window.
The order of appearance of the signals can be changed with Drag&Drop.
Zoom Operation
To get an overview of the value changes of the loaded wave signals the zoom fit  icon can be used.
To adjust the zoom factor use either the zoom out
icon can be used.
To adjust the zoom factor use either the zoom out  or the zoom in
  icon.
Zooming can also be done with the mouse wheel plus the pressed Ctrl key.
Using the stroke mouse button a time region of interest can also be selected.
icon.
Zooming can also be done with the mouse wheel plus the pressed Ctrl key.
Using the stroke mouse button a time region of interest can also be selected.
Time Marker
Moving the mouse within the wave area shows the time of the cursor location in grey color. By clicking within the wave area the time marker (in light red color) is set. The values of all signals are written with yellow background at the Marker location. In the Schem, Cone and Source window these values are also shown. The displayed values are always updated when setting a new marker position. The radix of the shown values can be changed between hexadecimal, decimal, binary or octal. If the time marker is set to a transition, then either a rising or falling edge icon is displayed as the value to indicate the transition type.
The time marker and with it the value display can be removed by clicking into the red field in the timeline.
Jump to Previous and Next Value Changes
With the first time position  and
and  icons the cursor can be moved to the start or end of the timeline.
The previous value change
icons the cursor can be moved to the start or end of the timeline.
The previous value change  and next value change
  icons jump to the next or previous value change of the selected signal(s).
Alternatively use the keys p or n.
If no signal is selected, the cursor jumps to the previous/next value change of all loaded signals.
icons jump to the next or previous value change of the selected signal(s).
Alternatively use the keys p or n.
If no signal is selected, the cursor jumps to the previous/next value change of all loaded signals.
Time Cursor
Clicking into the narrow line at the bottom of the wave area, a cursor can be set. The cursor labels can be edited to represent their meaning in your design. These cursor marks can be removed again by clicking their label in the timeline.
Signal Grouping
Clicking on signal names with Shift or Ctrl keys pressed will select some signals. With the popup they can be copied/moved to a group. The Group name can be edited. The value of this new group is shown as if the group members would form a bus. The group members can be dragged to a custom order.
Groups can also be renamed or removed with the popup menu.
Time Fields
The From and To fields reflect the displayed time range.
They can be edited with the suffixes p, n, u, m, s for pico-, nano-, micro-, milliseconds or seconds.
If the time unit is omitted, the number is interpreted as the number of time steps.
To go to the beginning of the time range, just enter a zero.
To go to the end of the time range, just enter end.
In the field named Goto Time a time with the same units as before can be entered.
To use calculated time spans, click to a reference point to set the red marker. From here one can go a calculated time span forward or backward by pressing the Ctrl key while dragging the mouse in negative or positive direction.
Bookmarks
From any view a bookmark can be added with the add bookmark  icon.
The proposed name can be changed by simply overwriting it.
A bookmarked view can be recalled anytime or deleted with the delete bookmark
icon.
The proposed name can be changed by simply overwriting it.
A bookmarked view can be recalled anytime or deleted with the delete bookmark  icon.
icon.
Working with the Cone Window
To debug a path that is loaded to the Cone window, the  button ("get all signals from the path displayed in the Cone window") can be used to transfer all the loaded signals to the Wave window.
As before, the value representations can be seen in the Cone window when setting the time marker.
button ("get all signals from the path displayed in the Cone window") can be used to transfer all the loaded signals to the Wave window.
As before, the value representations can be seen in the Cone window when setting the time marker.
Clock Domain Analyzer
The Clock Domain Analyzer can extract clock domain structures and search for circuits between different clock domains (Clock Domains Crossings, CDC).
This function can be invoked from the menu.
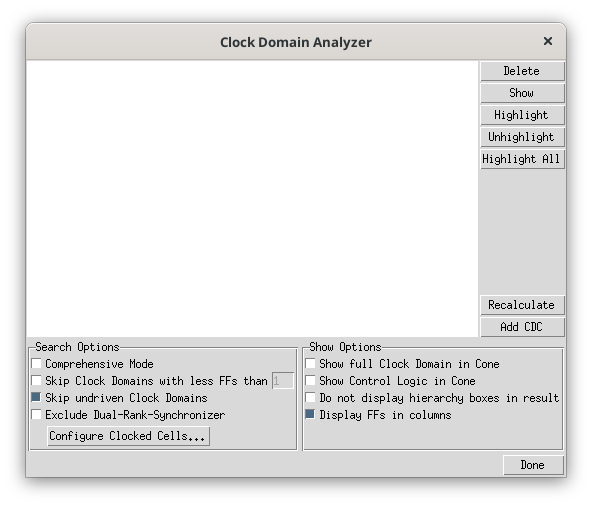
Prerequisites
For usable results it is necessary to provide as much information as possible. Especially the 'pin directions' of all cells should be known to the database.
If the RTL parser was used to read the design data then no additional steps are needed as the pin directions are committed by the parser.
If a netlist parser was used to read the design data then the pin directions may be unknown. The following suggestions show how the pin directions can be created or restored:
-
Use VHDL for netlists: As all used components must be declared before use, all pin directions are automatically known.
-
Provide an SDF file: The pin directions can be restored by reading the associated SDF file.
-
Provide 'Technology-Libraries' in Liberty format.
Additionally it’s necessary that you specify all clocked cells and the names of the clock ports in the Configure Clocked Cells dialog.
Clock Domain Browser
Configuration options for the clock domain and domain crossing search are:
-
Comprehensive Mode: Collects all possible clock domain sources for all FFs rather than trying to estimate the clock domain sources. As this will slow down the process and may create complex results it should be only enabled if clock domain violations are expected.
[ClockTree:Comprehensive:ok] -
Skip Clock Domains with less FFs than…: This option can be used to ignore small clock domains (e.g. asynchronous Flip-Flops).
[ClockTree:SkipLess:ok], [ClockTree:TargetCnt] -
Skip undriven Clock Domains: Normally, the clock domain search will stop with an error message if it finds any undriven clock signal. Use this option to ignore such errors.
[ClockTree:SkipUndriven:ok] -
Exclude Dual-Rank-Synchronizer: Exclude crossings which are synchronized by a Dual-Rank synchronizer.
[ClockTree:exclDrs:ok]
Configuration options for displaying the results in the Cone window are:
-
Show full Clock Domain in Cone: Displays the full clock domain rather than creating the default (strongly recommended) reduced view.
[ClockTree:ShowFullTree:ok] -
Show Control Logic in Cone: Also load control logic into the cone, e.g. logic connected to the 'select', 'set', 'reset', 'enable' input ports of cells.
[ClockTree:ShowControlLogic:ok] -
Do not display hierarchy boxes in result: The result is displayed in the Cone window without hierarchy boxes. This option is identically equal to the "turn off the visibility of hierarchy boxes" option in the Cone window.
-
Display FFs in columns: All Flip-Flops of the same clock domain will be shown in one column.
[ClockTree:colgroup:ok]
The clock domain search is automatically started when the dialog is opened the first time. It can be invoked again at any time by pressing the Recalculate button.
The result will be shown in a graphical way.
Each clock domain is displayed as a node that is labeled with the domain’s clock source and the number of clock pins driven by this source.
A (+ <NUMBER>) extension to the clock source label denotes that the clock domain has additional <NUMBER> clock sources.
The following screenshot shows a clock domain browser with a finished clock domain extraction.
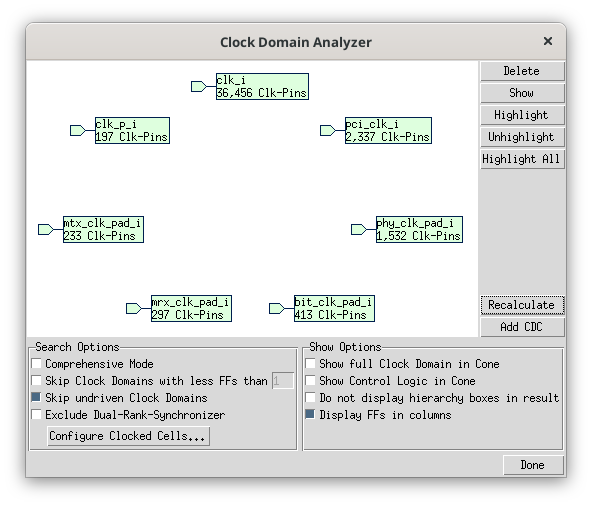
The following options are available for found clock domains:
-
Delete: Removes the selected clock domain or crossing from the result view.
-
Show: Shows the selected clock domain or crossing in the Cone window. This action can also be performed by double-clicking on the corresponding item in the graphical view.
-
Highlight: Highlights the selected clock domain or crossing with the actual highlight color.
-
Unhighlight: Remove the highlight information from the selected clock domain or crossing.
-
Highlight All: Highlight all clock domains with a different highlight color.
Clock Domain Crossing Browser
All selected clock domains are used as source and targets. If no clock domain is selected, then all domains are source and target.
The clock domain crossing search can be invoked by pressing the Add CDC button. The result will be shown as splines in the graphical view.
The following screenshot shows a CDC browser with a finished CDC search.
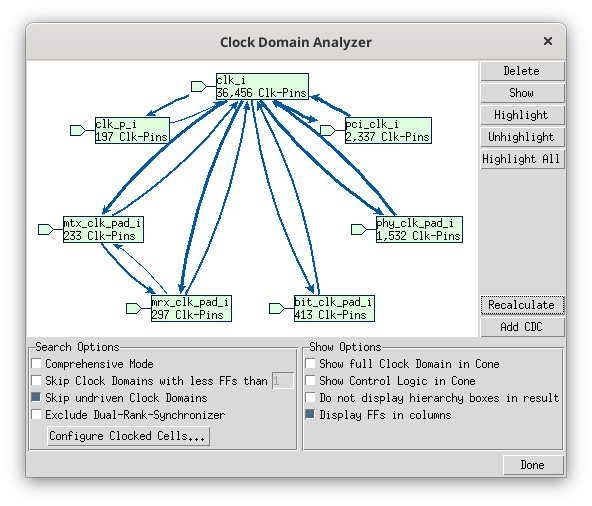
Configure Clocked Cells
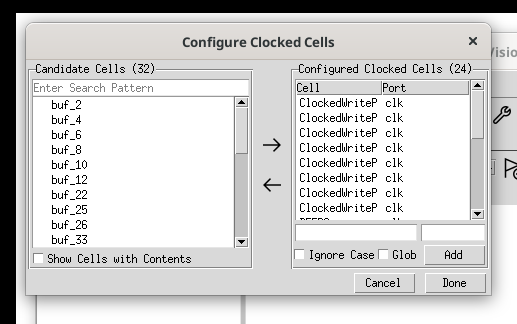
This dialog allows you to specify clocked cells and one or more clock port names for each cell.
The cell names are used for the Cone Extraction target Clocked Cells. The port names are used in the Clock Domain Analyzer.
The Print Schematic Dialog
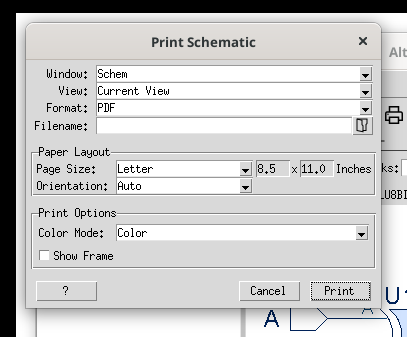
The Print dialog is available through the  icon, menu or Ctrl+P and provides the possibility to change certain print parameters:
-
Select one of the following supported window types to print (in addition to the default windows of each class, all additionally created windows will be listed as well):
[print:what] -
Select the view to print:
[print:view]-
Current View - Print the current view of the page. The area to print is limited by the current visible area (window borders).
-
All Pages - Print all schematic pages. If you redirect printing to a file, only one file will be created.
-
Current Page - Print the schematic as displayed on the screen after a zoom fullfit. The area to print is defined by the size of the schematic drawing, extra space around the drawing is not included.
-
-
-
Default Printer - Uses the default printer. The print command (
lprby default) might need to be adjusted to send the Postscript data to a printer.
On Windows the installed default printer will be used. [print:command] -
Postscript - Creates a file in Postscript format; enter the file name below.
-
PDF - Creates a PDF file; enter the file name below.
-
-
Filename - Specify the output filename, directory or command.
-
Orientation: Select the orientation: Landscape, Portrait or Auto (rotate whenever the schematic’s width/height ratio is < 1).
[print:orient] -
-
Mono prints in black & white
-
Color prints in original colors
-
Inverted color prints in inverted colors (white gets black and vice versa).
-
-
Show Frame: If turned on, a page frame will be drawn around the schematic. [
print:showFrame]
|
Note
|
On Windows the |
The Save Schematic as Image Dialog
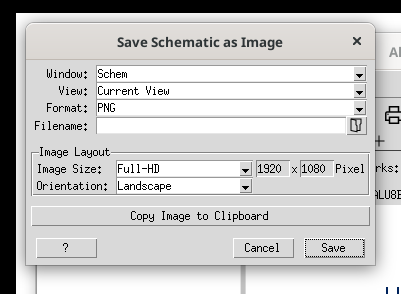
The Save Schematic as Image dialog is available through the  icon, menu and provides the possibility to change certain parameters:
-
Select one of the following supported window types to save the schematic as an image (in addition to the default windows, all additionally created windows will be listed as well):
[photo:what] -
Select the view to save:
[photo:view]-
Current View - Save only the visible part of the schematic.
-
All Pages - Save all schematic pages. Each schematic page will result in an image file. The page number is appended to the filename.
-
Current Page - Save only the current schematic page.
-
-
Image Type: Select the image type of the generated file.
[photo:dest] -
Image Size: Select the image size. If set to custom then you can specify the width and height of the image next to the option menu.
[photo:paper] -
Orientation: Select the orientation of the image.
[photo:orient]
Export Schematic
This chapter describes the export schematic dialogs and how to use them to export schematics to other tools.
Export EDIF 2.0.0 Schematics
This feature is no longer maintained, but is still available as is.
To activate the menu entry, the GateVision PRO tool needs to be invoked with the -enableExportEDIF command line option.
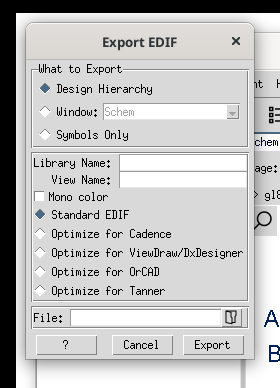
The Export EDIF dialog window is available through the menu. The EDIF export can be done in two different ways:
Optionally, the EDIF Library Name (defaults to the filename) and the EDIF Cell View Name (defaults to "") can be changed.
The following switches can additionally be turned on or off:
-
Mono color - use black on white background
-
Standard EDIF - follow the EDIF 2.0.0 standard.
-
Optimize for Cadence - tweak EDIF to fit Cadence Composer.
-
Optimize for ViewDraw/DxDesigner - tweak EDIF to fit Mentor DxDesigner.
-
Optimize for OrCAD - tweak EDIF to fit OrCAD.
-
Optimize for Tanner - tweak EDIF to fit Tanner (S-Edit).
Export Netlist
This chapter describes the Export Netlist dialog and how to use it to generate netlists in different formats.
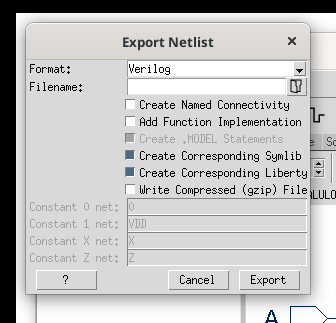
The Export Netlist dialog window is available through the menu.
The following output formats are supported:
-
Spice - Generic Spice.
-
Verilog - Structural Verilog.
-
Tcl - GateVision PRO specific Tcl netlist.
-
VHDL - VHDL netlist.
The following options are available:
-
Create Named Connectivity (Verilog format only) - Write the Verilog file using named connectivity.
-
Add Function Implementation (Verilog and VHDL) - Add a function implementation of selected primitives.
-
Create .MODEL Statements (Spice format only) - Create the corresponding
.MODELor.subcktstatements for primitive devices or macro models. -
Create Corresponding Symlib - Create a symbol library file containing symbol shape information.
-
Create Corresponding Liberty - Create a Liberty file containing cell and clock information.
-
Write Compressed (gzip) File - Create a gzip compressed output file.
If the output format is Spice then constant values are modeled as nodes using the names listed in this dialog.
Open/Save a Binfile
The current database contents can be stored into and retrieved from a file in binary format (the so called 'Binfile'), sometimes referred to as ZDB-file (it uses the .zdb filename extension by default). The binary file is a way to load big circuits very fast.
The batch-tools verilog2zdb and edif2zdb can be used to create a Binfile from Verilog or EDIF netlists as a background task (with no GUI).
Use the  icon or the menu to open a binfile in GateVision PRO.
The menu can be used to save a binfile from GateVision PRO.
SDF Files
The Standard Delay Format (SDF) files can be provided by selecting them in the Attach SDF dialog, which is available through the menu:
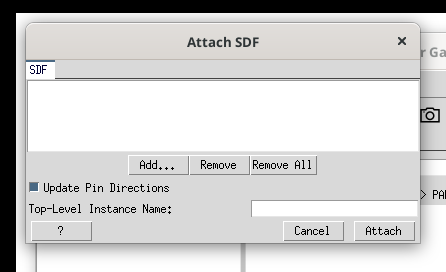
-
Use the Add, Remove, Remove All buttons to edit the list of SDF files to be linked to the Verilog design.
[SDF:FL]. -
If you enable the
Update Pin Directionsoption, pin directions are reconstructed from the SDF data. This can be used e.g. to create valid pin directions if no cell-library is given. All cells must have valid pin directions to show proper timing.
[Sdf:pindirupd] -
Top-Level Instance Namelets you choose the name of the top-level instance.
[Sdf:topInstName]
SDF Info
The SDF Info dialog can be opened with the Popup invoked on an object that contains SDF information. Therefore one or more SDF files need to be provided. This dialog shows timing information for selected items in the Schematic or Cone window.
The SDF Info dialog is divided in three sections: Configuration, Design Info, and Timing Info. Each section can be disabled or enabled by setting the checkbox next to the label of each part.
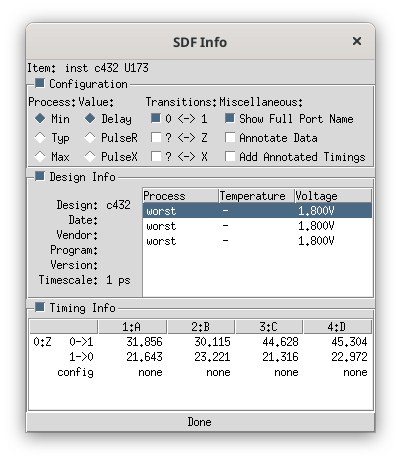
Configuration
-
Process, Value, and Transition - Select which process, value and transitions shall be shown at Timing Info section.
-
Show Full Port Name - The full port name will be shown in the Timing Info section. Disable this option to shorten long names e.g. to make configuration expressions more readable.
-
Annotate Data - If enabled, each timing value selected in Timing Info will be immediately annotated to the according pin/port in the schematic. Three timing values can be stored at each pin/port which can be switched by selecting a different process.
-
Add Annotated Timings - If the source of the path of the actual timing already has an annotated timing, the sum of both timings is shown. To tell the difference between real timing and accumulated timing, a
+is shown for accumulated timings.
Design Info
Shows design information provided by the SDF file(s) linked to the actual design.
Timing Info
Shows the timings for the currently selected net, pin, port or inst.
If a pin or inst is selected, the upper legend of the table shows the input-pins of the current instance and on the left side the output-pins. Bidirectional pins may be found in both legends.
If a net or port is selected, the upper legend shows the output-pins, the left legend the input-pins.
For each input/output pair, all transitions selected in Configuration are shown as a list.
Values shown in 'green' are explicitly given values from the SDF file.
Values shown in 'grey' are implicitly given.
If no value is given, a - is shown.
An optional configuration for each transition may be shown at the bottom of each transition list.
The configuration can be changed by clicking on the configuration entry.
Report Instance Count
This function can be invoked with the  icon, from the menu entry (for the top module only) or from the context menu of the Tree window (for the selected module).
The Report Instance Count feature counts the number of instantiated modules and primitives in the hierarchy tree below the current module and displays it in a separate dialog window.
Preferences
The Preferences dialog can be opened with the  icon or from the menu entry.
The Preferences dialog can be used to configure the GUI. All settings can be saved to (and read from) a Workspace file.
You can use the environment variable GV_GLOBAL_WORKSPACE to define a global workspace which is read at startup.
The Preferences Dialog
The buttons in the lower part of the Preferences dialog have the usual meaning:
The dialog is split into the following sections (tabs): Display, Schem, Cone, Source, Tree, Appearance, Mouse, and Misc.
The pictures below show the 'default' settings in the different dialog tabs.
The tooltips might give you useful information about specific items when running the tool.
To change one of the settings using the GUI API you can use the gui settings set command with the name shown in brackets after each option.
Display Properties
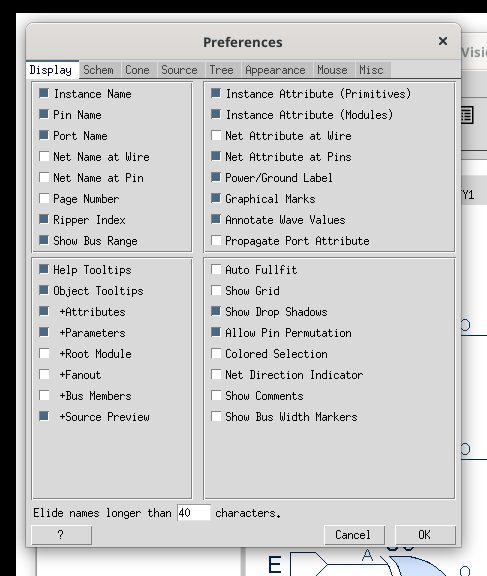
All preferences in this Display tab apply to the Schematic and Cone windows of all Pane windows simultaneously.
-
Instance Name - Toggle display of instance names in schematic.
[nlv:showinstname] -
Pin Name - Toggle display of pin names in schematic.
[nlv:showpinname] -
Port Name - Toggle display of port names in schematic.
[nlv:showportname] -
Net Name at Wire - Toggle display of net names at wires in the schematic.
[nlv:shownetname] -
Net Name at Pin - Toggle display of net names at pins in the schematic.
[nlv:shownetnamepin] -
Page Number - Toggle display of page numbers at off page connectors.
[nlv:showpagenumbers] -
Ripper Index - Toggle display of ripper index at netBus ripper.
[nlv:showripindex] -
Show Bus Range - Toggle display of the bus range at pinBus and portBus objects.
[showBusRange] -
Instance Attribute (Primitives) - Toggle display of primitive instance attributes in schematic.
[nlv:showattribute] -
Instance Attribute (Modules) - Toggle display of module instance attributes in schematic.
[nlv:showcellname] -
Net Attribute at Wire - Toggle display of net attributes at the wire.
[nlv:netattrwire] -
Net Attribute at Pins - Toggle display of net attributes at the pins.
[nlv:netattrpin] -
Power/Ground Label - Toggle display of labels of power and ground nets in schematic.
[nlv:showpgtype] -
Graphical Marks - Toggle display of graphical marks.
[nlv:showmarks] -
Propagate Port Attribute - Propagate port attribute to the corresponding pin.
[nlv:portAttrAtPin] -
Help Tooltips - Toggle display of help tooltips in the GUI.
[helpTooltips] -
Object Tooltips - Toggle display of database object tooltips in the GUI.
[tooltips] -
+Attributes - Toggle display of attributes in the tooltips in schematic; this only applies to database objects that have attributes set.
[tooltipsWithAttrs] -
+Parameters - Toggle display of instance/cell parameters in the tooltips.
[tooltipsWithParameters] -
+Root Module - Toggle display of the root module in the tooltips in schematic.
[tooltipsWithRoot] -
+Fanout - Toggle display of fanout in the tooltips in schematic.
[tooltipsWithFanout] -
+Bus Members - Display bus members in the tooltips for pinBus and netBus objects.
[tooltipsWithMembers] -
+Source Preview - Display source code preview in tooltip for files smaller than 256MB.
[tooltipsWithSource], [tooltipsWithSourceFilesizeLimit], [tooltipsWithSourceLineWidthLimit] -
Auto Fullfit - Automatically zoom new modules to fullfit.
[nlv:autoFullfit] -
Show Grid - Display a dotted grid (visible only with an appropriate zoom factor).
[nlv:showGrid] -
Show Drop Shadows - Toggle drop shadow effect on instances.
[nlv:dropshadow] -
Allow Pin Permutation - Allow the permutation of pins to reduce wire crossings. If a custom symbol shape is used then the symbol needs to allow pin permutation.
[nlv:pinpermute] -
Colored Selection - Use the goto color for additional selection feedback.
[nlv:coloredSelection] -
Net Direction Indicator - Decorate net objects with additional logical direction indicator icons.
[nlv:netDirIndicator] -
Show Comments - Show graphical object comments.
[nlv:showComments] -
Show Bus Width Markers - Add graphical marks to netBuses that show the bus widths.
[nlv:showBusMarkers] -
Elide names longer than X characters - Labels longer than a given limit are displayed clipped with three leading dots. A value of 0 disables text eliding.
[nlv:elidetext]
Schematic Properties
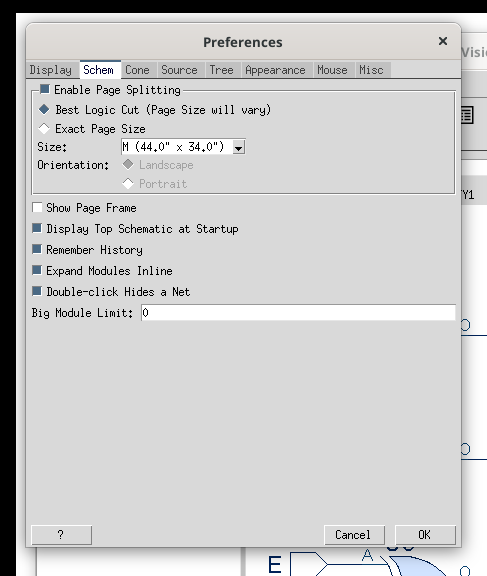
All preferences in this Schem tab apply to the Schem window of all Pane windows simultaneously.
-
Enable Page Splitting - Activate page splitting for the Schem window.
[schem:splitpage] -
Best Logic Cut (Page Size will vary) - Use a built-in automatism to determine the actual page size of the schematic; use the Size listbox to change the preferred size factor.
[schem:fitpage] -
Exact Page Size - Use a fixed page size for schematic generation; use the Size listbox to change the preferred sheet size; there will be a visible frame surrounding the schematic in this mode.
[schem:fitpage] -
Size - Select the page size.
[schem:logicSize], [schem:exactSize],
[schem:sheetwidth], [schem:sheetheight] -
Orientation - Toggle the orientation of the schematic; choose between Landscape (width > height) and Portrait (height > width) mode.
[schem:orientation] -
Display Top Schematic at Startup - This option controls whether the top-level schematic is automatically displayed in the default Schem window.
[startTopSchematic] -
Remember History - Enable the forward and backward history buttons.
[schem:history] -
Expand Modules Inline - Expand the contents of modules inline in the current module using the (+) button in the top left corner.
[schem:expandInline] -
Double-click hides a Net - A double-click on a net toggles the hide state of the net.
[schem:doubleNetHide] -
Big Module Limit - Before the schematic of a module is generated the number of objects the module contains is compared with the number specified here. If the number of components in the module is less than this limit, the schematic is generated without user interaction.
Increase this number for fast computers and decrease it for slower machines.
This value is also used as a limit if you load heavy connected Nets/Signals to the Cone window using from the context menu.
A value of0disables the limit. The default value is 60,000.
[bigModuleLimit] -
Specifies a time limit for the internal schematic generation algorithm (in seconds).
If the internal algorithms run out of time, then the algorithms try to speed up (and skip some of the optimizations).
The quality of the layout will degrade.
[schem:nlvTimeLimitInt]
Cone Properties
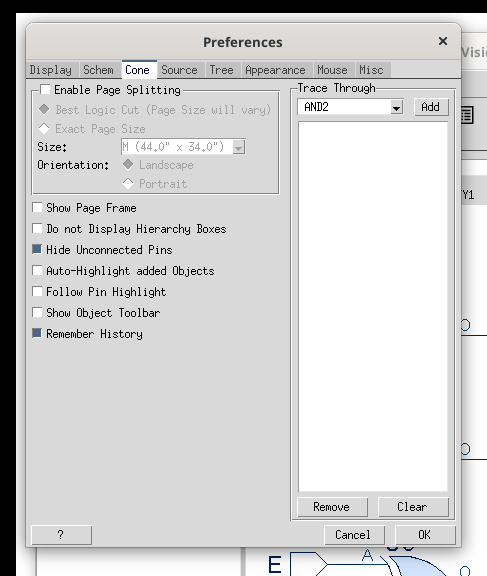
All preferences in this Cone tab apply to the Cone window of all Pane windows simultaneously.
-
Enable Page Splitting - Activate page splitting for the Cone window.
[cone:splitpage] -
Best Logic Cut (Page Size will vary) - Use a built-in automatism to determine the actual page size of the schematic; use the Size listbox to change the preferred size factor.
[cone:fitpage] -
Exact Page Size - Use a fixed page size for schematic generation; use the Size listbox to change the preferred sheet size; there will be a visible frame surrounding the schematic in this mode.
[cone:fitpage] -
Size - Select the page size.
[cone:logicSize], [cone:exactSize],
[cone:sheetwidth], [cone:sheetheight] -
Orientation - Toggle the orientation of the schematic; choose between Landscape (width > height) and Portrait (height > width) mode.
[cone:orientation] -
Do not Display Hierarchy Boxes - If this option is enabled then the hierarchy boxes are not displayed in the Cone window. You get a flat view of your design. But the path is still visible in the instance name.
[cone:hierfilter] -
Hide Unconnected Pins - Unconnected instance pins are hidden automatically in the Cone window (until they are connected to a loaded, i.e. visible, net). You may also use a double-click with the left mouse button on the border of an instance in Cone window to quickly toggle the hide mode.
[cone:autohide] -
Auto-Highlight added Objects - Automatically highlight added objects.
[cone:autohighlight] -
Follow Pin Highlight - A double click on a highlighted pin or port object will propagate the highlight color to the added object(s).
[cone:followPinHighlight] -
Show Object Toolbar - Toggle the visibility of the object toolbar to access the delete function at selected instance and port objects.
[cone:objtoolbar] -
Remember History - Enable the forward and backward history buttons.
[cone:history] -
Max Path Length to Power/Ground - When double-click extends the schematic by a device, then paths to power and ground are searched and also added automatically. This search can be limited to the given number of added instances.
[cone:devicePathMax] -
Specifies a time limit for the internal schematic generation algorithm (in seconds).
If the internal algorithms run out of time, then the algorithms try to speed up (and skip some of the optimizations).
The quality of the layout will degrade.
[cone:nlvTimeLimitInt] -
Trace Through - A double click in the Cone window will go through all cells specified here as trace through cells. To enter trace through cells either select them from the drop down menu or enter a glob style pattern to add all cells matching the given pattern.
Source Properties
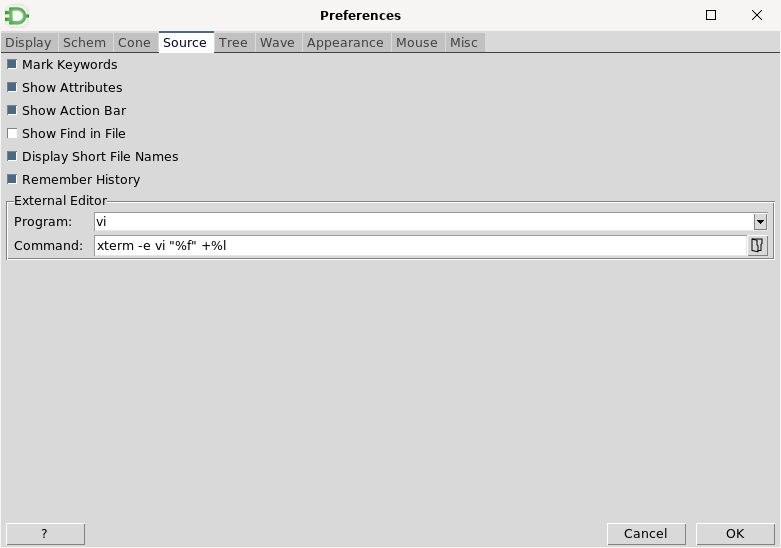
-
Mark Keywords - Syntax highlights for known keywords.
[Syntaxhighlight] -
Show Attributes - Display attribute values of net and pin objects.
[ShowAttributes] -
Show Action Bar - Display action bar when clicking on objects in the Source window.
[ShowActionBar] -
Show Find in File - Always show the Search for toolbar.
[source:showFindInFile] -
Display Short File Names - Display short file names in the Source window’s file selection list instead of full paths
[source:displayShortFnames] -
Remember History - Enable navigation history in the Source window.
[source:history] -
External Editor - Choose your favorite external editor (must be installed on the machine) for viewing and editing source files from Source window.
The following formatting arguments are supported:-
%f- current file name in Source window -
%l- current line number in file displayed in Source window
[source:editor], [source:editorCmd]
-
Tree Properties
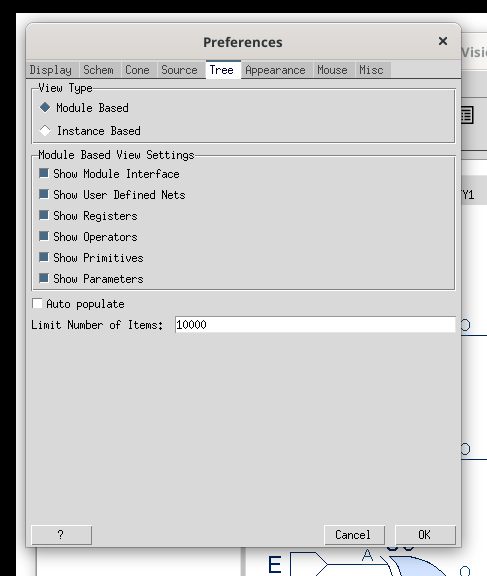
The Tree widget supports two different view types:
-
Module Based - Show a folded tree sorted and grouped by modules.
[Tree:ModuleView] -
Instance Based - Sort the tree by instances.
[Tree:ModuleView]
In the module based view additional information can be displayed in the Tree:
-
Show Module Interface - Add a node to the tree to show the I/O ports of a hierarchical module.
[Tree:Show:PORT] -
Show User Defined Nets - Add a node to the tree to show all nets and buses not automatically generated by a parser.
[Tree:Show:NET] -
Show Registers - Add a node to the tree to show all clocked elements of a module.
[Tree:Show:REG] -
Show Operators - Add a node to the tree to show hierarchical blocks with a known function.
[Tree:Show:OPER] -
Show Primitives - Add a node to the tree to show all primitives of a module.
[Tree:Show:PRIM] -
Show Parameters - Add a node to the tree to show all parameters of a module.
[Tree:Show:PARAMS]
General Tree preferences:
-
Auto populate - If the database was opened from a binfile using
quick mode, then the auto populate option can be used to automatically populate modules to see the entire contents.
[Tree:AutoPopulate] -
Limit Number of Items - Limit the number of children in each sub-tree.
[Tree:Limit]
Wave Properties
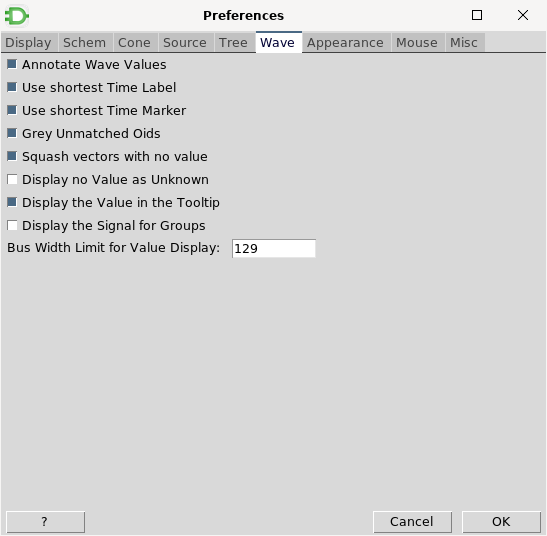
-
Annotate Wave Values - Toggle annotation of logic values from the Wave window in the Schematic and Cone window.
[nlv:showval] -
Try to shorten the displayed time for the label by dividing it by 1000 as long as it is divisible by 1000.
Then, the value will be divided by 1000 one more time in case the result is divisible by 100. Example: 3100000ps would be converted to 3.1us.
[Wave:useShortestTimeLabel] -
Try to shorten the displayed time for the marker by dividing it by 1000 as long as it is divisible by 1000.
Then, the value will be divided by 1000 one more time in case the result is divisible by 100. Example: 3100000ps would be converted to 3.1us.
[Wave:useShortestTimeMarker] -
Gray out all unmatched Oids in the signal tree.
[Wave:greyUnmatchedOids] -
If a vector contains one bit with 'no value', only one 'no value' bit is displayed.
Example: '0X???' would be reduced to '?'.
[Wave:singleNoValue] -
Display 'no value' as 'unknown' (i.e. show '?' as 'X').
[Wave:noValueAsX] -
Display the value for the signal under the cursor in the tooltip.
[Wave:showValueTooltip] -
Do not display the value for a bus where the bus width exceeds the given limit.
[Wave:busWidthLimit]
Appearance Properties
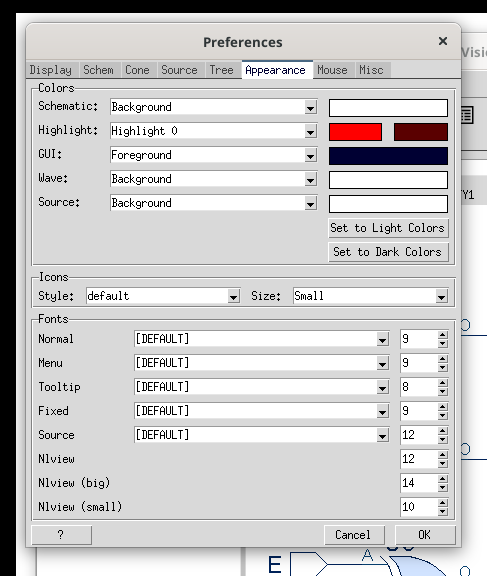
In this tab you can customize the appearance of the tool. There are several predefined color schemes to choose from. You can customize one of these color schemes by clicking with the mouse on the preview label of the color. The highlight color is subdivided into a foreground and a background color. The selection background color has a higher priority as the highlight background color.
|
Note
|
All changes to Schematic apply to the Schem and Cone window of all Pane windows simultaneously. |
-
Schematic - A listbox for choosing the schematic element; the current color for the currently selected schematic element is displayed on the right; click on that color to change it.
-
Highlight - A listbox for choosing the highlight color; the current colors for the currently selected highlight list are displayed on the right; the left color is the foreground highlight color and the right color is the background highlight color; click on the colors to change them.
Please note that the highlight background color of the Schem and Cone window is automatically derived from the highlight foreground color.
You can choose between 16 different colors for highlighting. -
GUI - A listbox for choosing a GUI element; the current color for the currently selected GUI element is displayed on the right; click on that color to change it.
-
Wave - A listbox for choosing an element of the Wave window; the current color for the currently selected element is displayed on the right; click on that color to change it.
-
Source - A listbox for choosing an element of the Source window; the current color for the currently selected element is displayed on the right; click on that color to change it.
-
Set to Light Colors - Reset the colors to the built-in 'light' color set (this is the default color scheme).
-
Set to Dark Colors - Reset the colors to the built-in 'dark' color set.
-
Icon Size - Select the size of icons in the toolbars.
You can also customize the fonts used in {GateVision PRO}:
-
Normal - the generic GUI font used for buttons, labels, lists.
[fontFamily:normal], [fontSize:normal] -
Menu - the font used for menus.
[fontFamily:menu], [fontSize:menu] -
Tooltip - the font used in tooltips.
[fontFamily:tooltip], [fontSize:tooltip] -
Fixed - the fixed-width font used in the Console and Messages windows.
[fontFamily:fixed], [fontSize:fixed] -
Source - the font used in the Source windows.
[source:fontFamily], [source:fontSize] -
Nlview - the font sizes used in the schematic displays (Nlview widget) of Schem, Cone, and Infobox windows. Please note that the configured size corresponds to zoom level 1, and that the font family cannot be configured.
[fontSize:nlview], [fontSize:nlview_big], [fontSize:nlview_small]
Mouse Properties
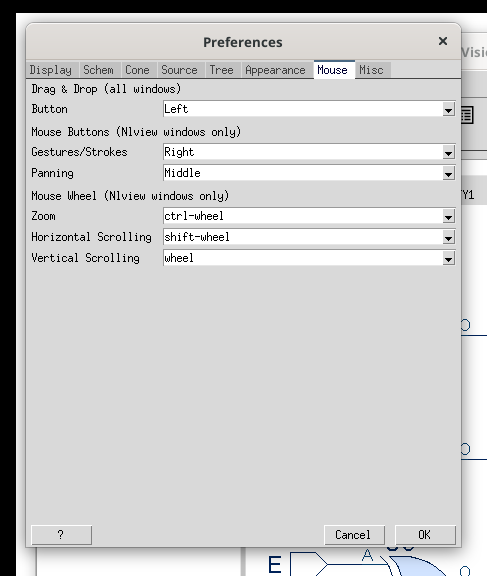
-
Drag & Drop Button - Select the mouse button used for Drag & Drop.
[dndbutton] -
Gestures/Strokes Button - Select the mouse button used for drawing gestures/strokes in Nlview windows (Schem, Cone, etc.).
[button_gestures] -
Panning Button - Select the mouse button used to pan Nlview windows (Schem, Cone, etc.).
[button_panning] -
Zoom Wheel - Select the mouse wheel + modifiers to zoom in Nlview windows (Schem, Cone, etc.).
[wheel_zoom] -
Horizontal Scrolling Wheel - Select the mouse wheel + modifiers to scroll horizontally in Nlview windows (Schem, Cone, etc.).
[wheel_scroll_x] -
Vertical Scrolling Wheel - Select the mouse wheel + modifiers to scroll vertically in Nlview windows (Schem, Cone, etc.).
[wheel_scroll_y]
Misc Properties
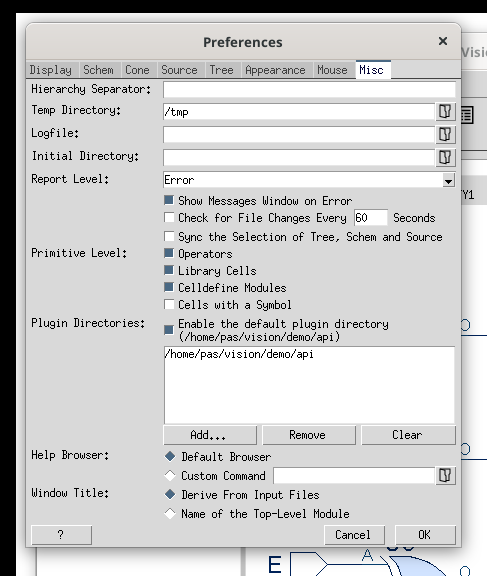
-
Hierarchy Separator - If the specified character is not used in any name then it will be used as a separator character for path names.
[hiersep] -
Temp directory - Choose the directory, where GateVision PRO can store temporary files (e.g. for parsing Verilog netlist files on Windows).
[tempdir] -
Logfile - Write all warning and error messages shown in the Console window to this file. If Report Level is
Debugthen additional information (not shown in the Console window) is written to this file.
[logfile] -
Initial Directory - Use this initial directory for all file dialogs.
[initialDirectory] -
Report Level - Select the level of created messages.
[info] -
Show Messages Window on Error - In case of an error message the Messages window becomes visible.
[showConsoleOnError] -
Check for File Changes Every - If enabled then the current design’s files will be checked for changes at regular intervals. In case a change is detected, an appropriate message will be displayed in the Console window, asking the user to reload the design.
[filewatcher:enabled], [filewatcher:interval] -
Sync the Selection of Tree, Schem and Source - If enabled each selection in Tree and Source and each module change in Schem is synchronized to all Tree, Schem and Source windows. [
syncToObject] -
Primitive Level - Specify hierarchical cells as primitives.
-
Operators are all cells with a known function.
-
Library Cells are cells flagged as coming from a library (e.g. a binlib).
-
Celldefine Modules are modules surrounded by the Verilog macros
`celldefineand`endcelldefine. -
Cells with a Symbol are all cells with a @symbol attribute (from a symlib).
[primLevelOper],
[primLevelLibCell],
[primLevelCelldefine],
[primLevelSymbol]
-
-
Enable the default plugin directory - If checked, the installation’s default plugin directory is scanned for plugin scripts.
[plugins:usedefaultdir] -
Plugin Directories - Edit the list of directories that are scanned for plugin scripts.
[plugindirs] -
Help Browser - Select the type of help browser to use:
-
Default Browser - Use the operating system’s default web browser and use it as the help browser.
-
Custom command lets the user specify the path to an external web browser (e.g. the path to the system’s Firefox executable).
[help:browser_type], [help:browser_command]
-
-
Window Title - Select if the displayed window title is derived from one of the input filenames or from the top module name.
[deriveTitle]
Select Display Attributes
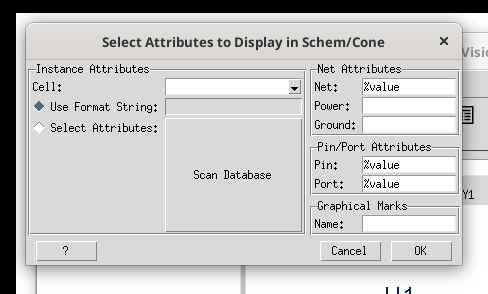
This dialog is accessible from the menu. With this dialog the attributes to display in the Schematic and Cone window can be selected.
In this dialog you can define display rules for different kinds of attributes. You must enter a format string that defines the attributes to display.
The entry field for the various Instance attributes define format strings for instances of each cell.
After pressing the "Scan Database" button all available attributes are shown as check buttons and can be selected to make them visible.
The entry fields Net, Power, Ground, Pin and Port define global format strings for attributes at each of those objects.
In the Graphical Marks field an attribute name containing graphical marks information can be specified.
Select Symbol
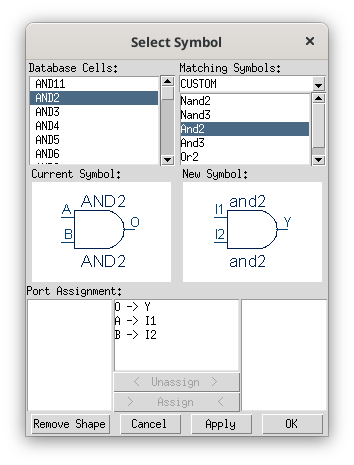
This dialog is accessible from the Select Symbol entry in the context menu and allows you to assign symbol shapes to modules displayed as boxes in the Schem and Cone window.
The list on the left side shows all available database cells. A preview of the selected cell is displayed below the list. This preview shows how the cell will be drawn in the Schem and Cone window.
On the right side a symbol can be selected. This could either be one of the built-in symbol shapes or a custom symbol. A list of all available custom symbols coming from a symbol library is displayed. The preview window shows how the selected cell would be drawn in the Schem and Cone window if this symbol shape is assigned by pressing the Apply or OK button.
If the order of ports at the cell loaded to the database does not match to the order of ports in the symbol shape definition then the port order can be changed using the "Port Assignment" dialog at the bottom of the Select Symbol dialog.
If a selected database cell already has an assigned symbol shape, the Remove Shape button can be used to remove the assigned symbol shape.
The Blocklevel View
The Blocklevel View mode is an abstract view of the original design that displays data flow between instances instead of explicit connectivity.
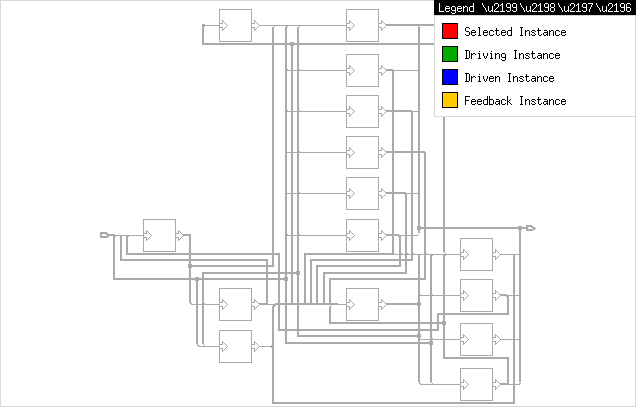
The Blocklevel View mode can be activated by clicking the  icon in the toolbar or by selecting from the main menu.
The Blocklevel View replaces all hierarchical cells by special blocklevel cells (indicating signal flow) and merges all nets/buses connecting two instances by exactly one artificial net.
Selecting an instance in the Blocklevel View mode colors the neighboring instances such that it becomes obvious which neighboring instance is driving the selected instance, is driven by the selected instance, or is both driving and driven (feedback) by the selected instance.
The behaviour of the Blocklevel view can be configured by activating features accessible from the menu.
Console Window
The Console window can be opened with the  icon in the toolbar or with from the main menu.
The tool is based on Tcl/Tk and the Console window displays error or warning messages and provides direct access to the Tcl interpreter. The user can type in any Tcl command to execute it.
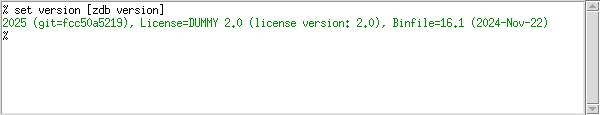
The example above shows a Console window with one user command.
The Console's main purposes are:
-
Evaluate Tcl commands. It accepts the complete Tcl/Tk language and some tool specific extensions, like the database API and GUI API. These extensions make the tool very flexible, e.g. through the usage of user scripts called 'Userware'.
-
Present Warnings and Errors. In some cases the GUI emits warnings, errors or information that are not displayed in a message box; they’re rather displayed in the Console in a different color (blue for warnings, green for return values of executed commands and red for errors).
Parser errors which contain file and line information can be clicked with the mouse to display the file in the Source window.
The Console also features a small context menu with text-based copy & paste functionality, the option to clear the Console window and the possibility to save the contents as a text file.
Statusbar
The appearance of the Statusbar (appears at the very bottom) can be toggled by selecting from the main menu.

The statusbar displays statistics of the loaded design:
-
the number of errors and warnings (by clicking on this field, the Messages window will be displayed).
-
the memory consumption (by clicking on this field, a detailed report will be displayed).
-
the number of loaded design files.
Messages Window
The Messages window can be opened with the  icon in the toolbar or with from the main menu.
The Messages window shows all messages issued to the internal messaging system.
By default only error messages are displayed. The type of messages to be shown can be selected from the "Level" combobox.

Connectivity Browser
The Connectivity Browser can be opened with from the main menu or from the submenu when right-clicking a net or a net bus.
The Connectivity Browser shows the connectivity of the selected net or netBus.
It provides a list of the connected pins and ports. Connection Details displays a port/pin centric view for the port/pin selected in Connections.
In the Net Details and NetBus Details an overview of the entire connectivity of the selected net or netBus is shown.
The net or netBus can be selected via the popup menu or can be dragged and dropped in the Browser’s tab.
In the signal mode all connected pins and ports of the selected signal are listed. The option "Show Hierarchical Connections" adds all directly connected pins and ports of the traversed modules. The Signal Details shows a signal overview at the top level of the signal.
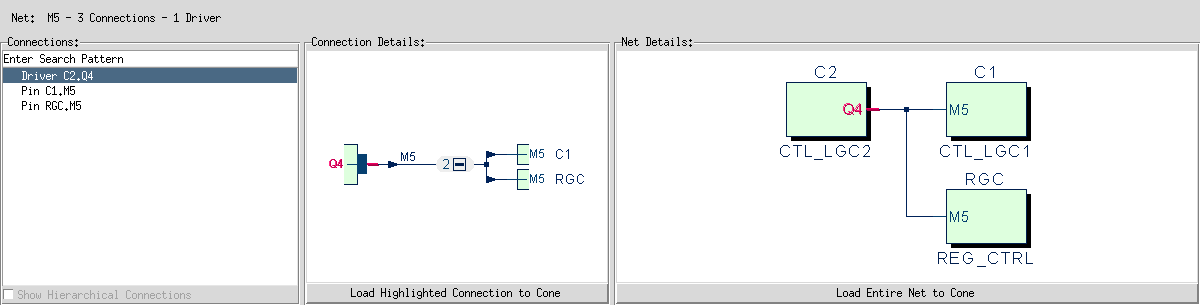
Infobox
The Infobox window can be opened with the  icon in the toolbar or with from the main menu.
The Infobox shows additional information of the selected object.
In the first column the appended attributes are listed.
Show internal attributes in the list by toggling the
"Show internal attributes" checkbox (this also includes calculated attributes).
[showInternalAttributes]
In the second column the active flags are shown.
The third area contains a detailed view of the object.
It show e.g. hidden ports, highlights and connection details.
For large elements this view is optimized for performance reasons and can be adjusted by increasing the global Big Module Limit.
If signal mode is enabled an overview of the signal is shown.
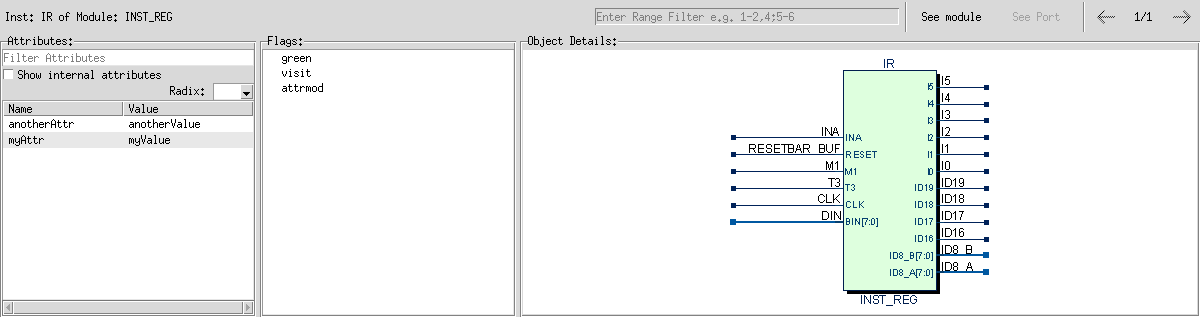
If a bus is selected a filter can be applied to display chosen parts. Valid strings are single bits like 1,2,3 or ranges e.g. 1-3, or mixed 1-3,4.
Attributes
The Attributes shows attributes of the selected object.
Userware
GateVision PRO can execute Tcl scripts (we call them Userware). These scripts can access the GUI API and the database API and Tk (e.g. to extend the GUI). To execute an Userware script, you have several possibilities:
-
Choose the menu entry
-
Specify the command line option
-userware <scriptname.tcl>at startup -
Type
source "scriptname.tcl"in the Console window
Learn more about Userware scripts here:
-
API Tutorial - Learn how to write Userware scripts
-
GUI API - Learn how to access the GUI components
-
Database API - Learn how to access the database
The Plugins Dialog
The Plugins dialog can be opened with the  icon or from the menu entry.
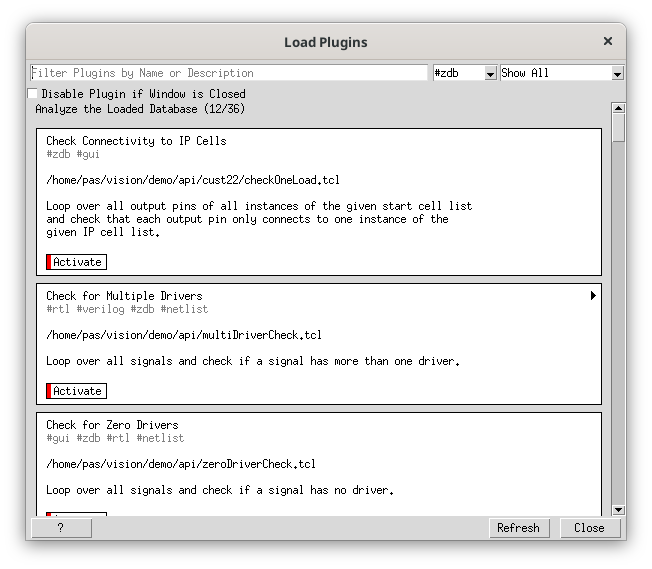
The Plugins dialog lets the user explore and load plugins, which are Userware Tcl scripts with 'plugin character' in contrast to just being mere 'API usage examples'.
The dialog lists all plugin scripts found in the configured 'Plugin Directories' - you can change the list of directories by the Plugin Directories section in the Misc tab of the Preferences dialog, or by using the command line option -pluginDir.
A specific plugin can be loaded by clicking on the plugin’s Activate button. The behavior of some plugins can be configured via the Configure button.
The Filter input field lets you perform a keyword search on the list of plugins.
Each Plugin is tagged with one or more keywords to additionally categorize it. The list of Plugins can also be filtered based on these tags.
Some Plugins create a tabbed window.
If the checkbutton "Disable Plugin if Window is Closed" is enabled, then closing a tab (e.g. by clicking the 'x' in the tab) will unload and therewith disable the corresponding plugin.
[plugins:unloadondestroy]