Review the current waveform of selected net or selected segment in time domain and
frequency domain.
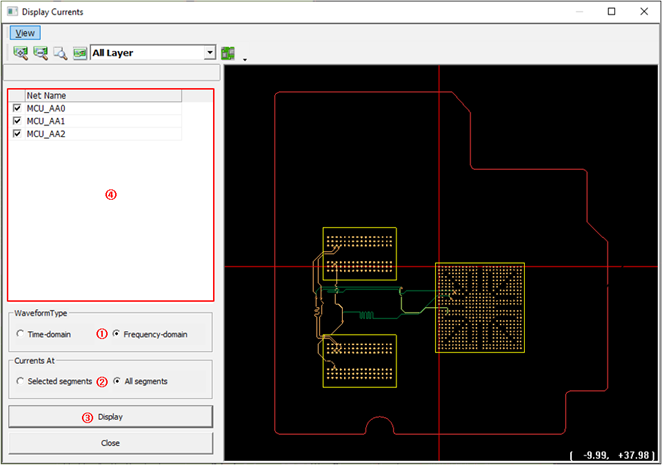
Figure 1.
Waveform Type: You can select waveform type. The time-domain or
frequency-domain.
Currents At: You can view net result or segment result. When All segments
option is selected, the results of all selected nets in the Net Name Tree
region are displayed. When selecting the Selected segments option, you must
click the desired segment on the screen to select it.
Display: Display result in pre-selected format.
Net name tree region: All nets belong to simulated model are listed
here.
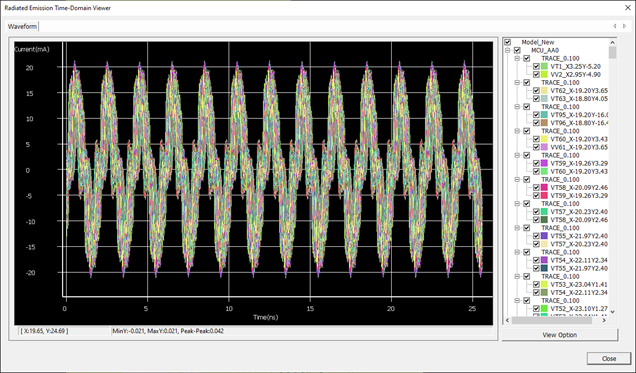
Upon selecting Waveform Type as Time-Domain and clicking Display menu, the
Radiated Emission Time-Domain Viewer dialog opens, and
current waveforms of net will be displayed. You can review all input and output of
each segment are displayed. Figure 2.
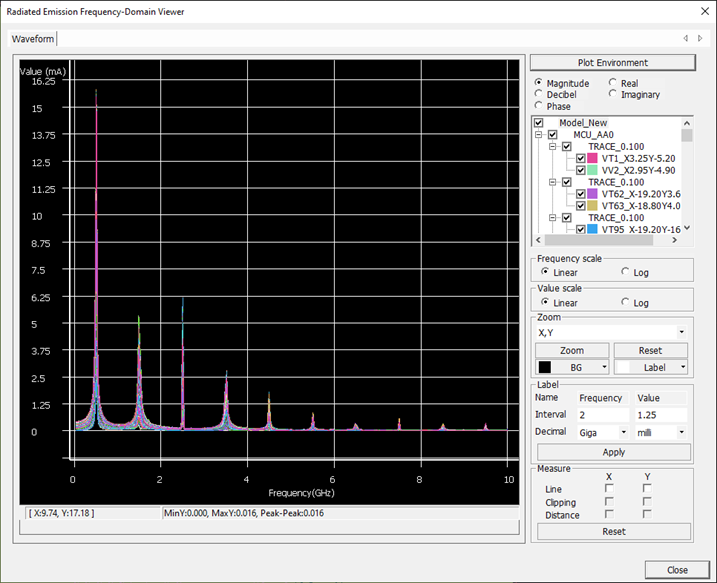
Upon selecting Waveform Type as Frequency-Domain and clicking Display menu, the
Radiated Emission Frequency-Domain Viewer will be open and current of net will be
displayed in frequency based. The current magnitude values among ports are initially
displayed.
You can change the segment port pair selections and change the plot type to decibel,
phase, real number, or imaginary number. Also, you can choose the scale of frequency
axis or value axis. Many display and measurement options are available in the
Frequency-Domain Viewer dialog. Figure 3.
Current waveform display region.
Select the display type to be displayed.
Toggle on and off to display certain desired waveform.