[11] Monitoring Engine Metrics and Application Topics
The Monitoring tab provides the ability to monitor the engine metrics that can help determine which part of the application is causing data bottlenecks, among others.
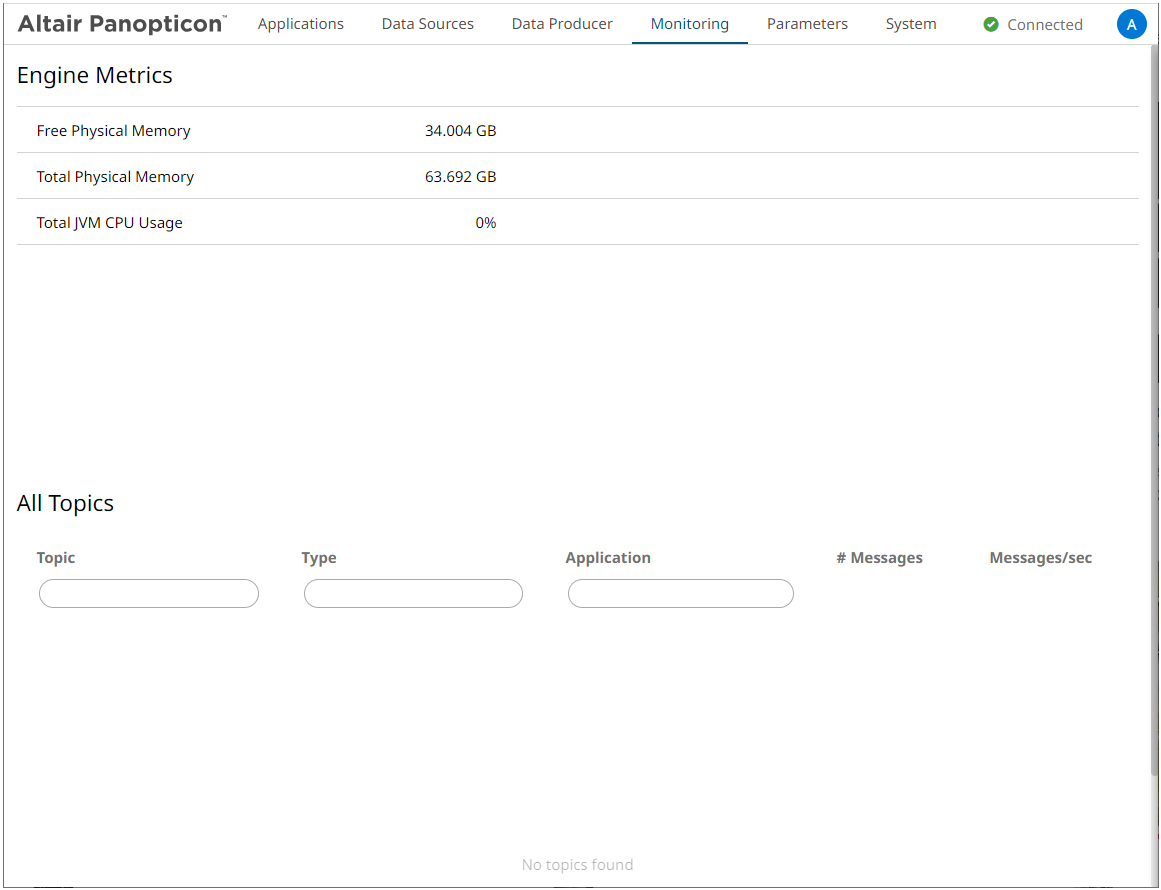
| Engine Metric | Description |
|
Free Physical Memory |
The amount of free physical memory available to the Panopticon Streams. |
|
Total Physical Memory |
The total amount of physical memory. |
|
Total JVM CPU Usage |
The recent CPU usage for the Java Virtual Machine process. |
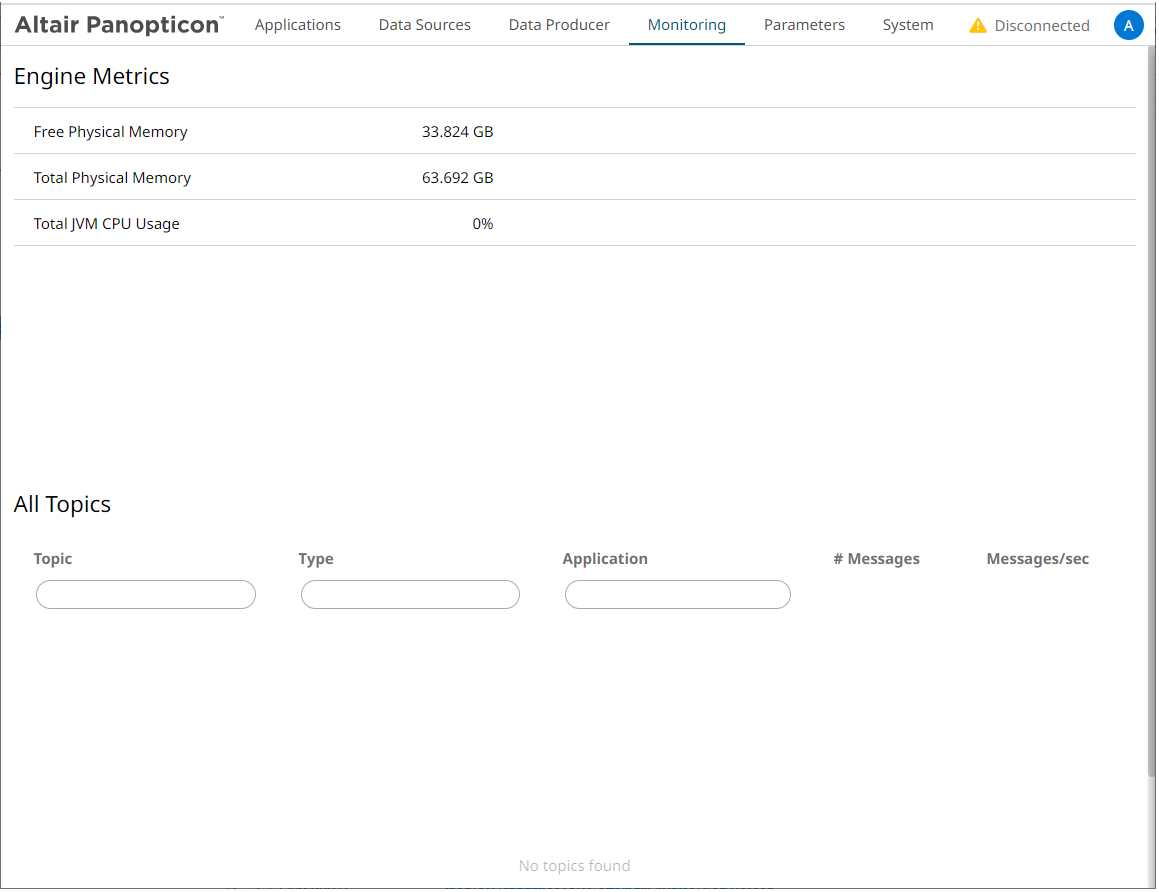
Monitoring tab when disconnected to the engine
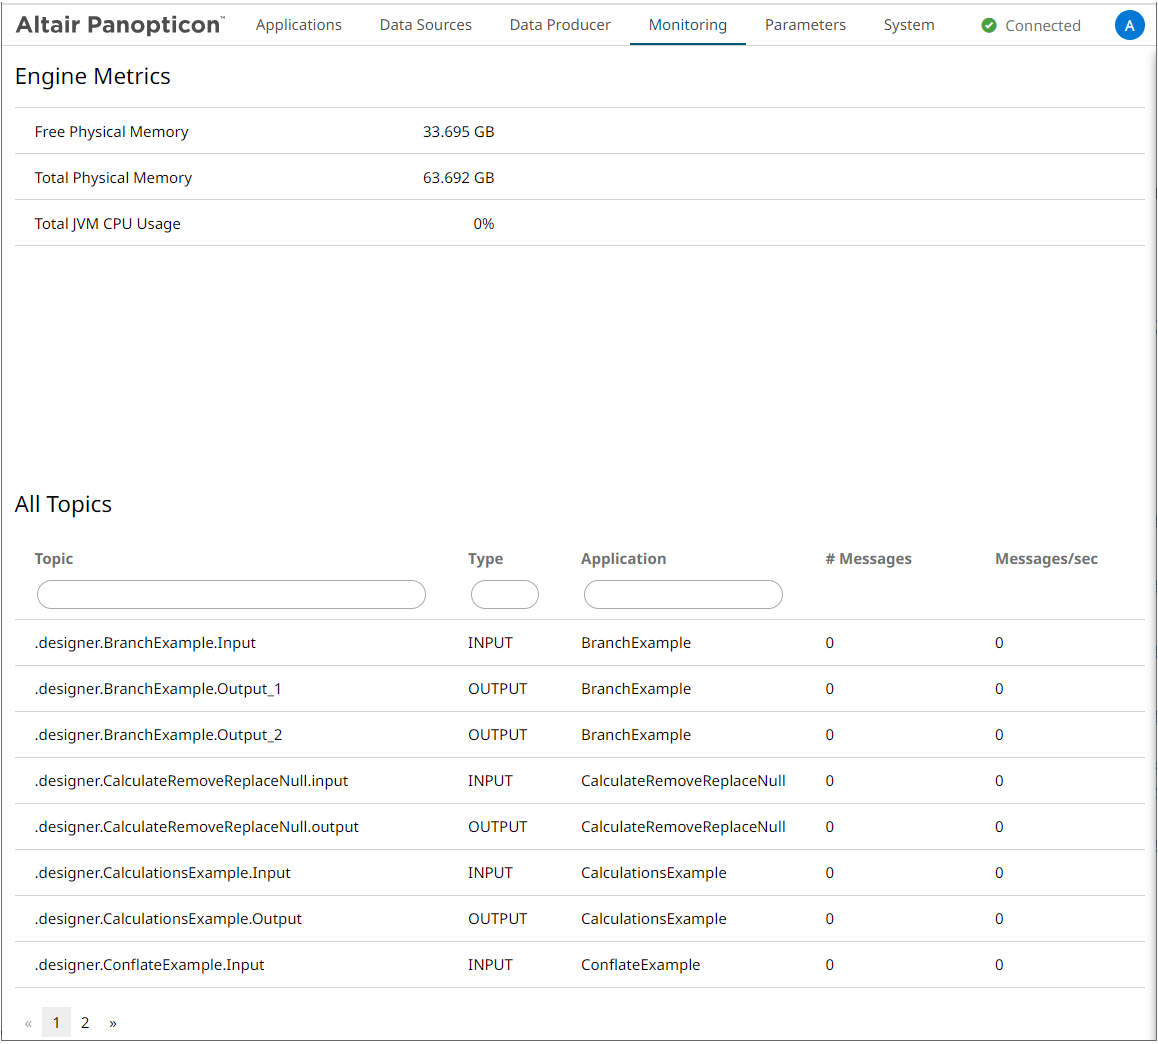
Monitoring tab when the engine has been started along with some applications. The list of input and output topics is displayed.
(c) 2013-2025 Altair Engineering Inc. All Rights Reserved.