Visualization Title Rows
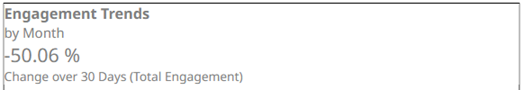
Allows you to add multiple title rows in the visualization. In addition to data-driven dashboard parameters, the Title can contain an informative summary and/or single KPI values on rows below the first row such as below:
- Enter the visualization’s Title, if needed.
NOTE: You can also opt not have a visualization title. Click
 to delete. Consequently, this would hide the entire title bar. This is recommended when creating small graphs.
 - To add more titles, click
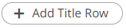 .
.
Then enter the Title.
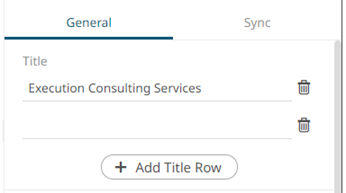
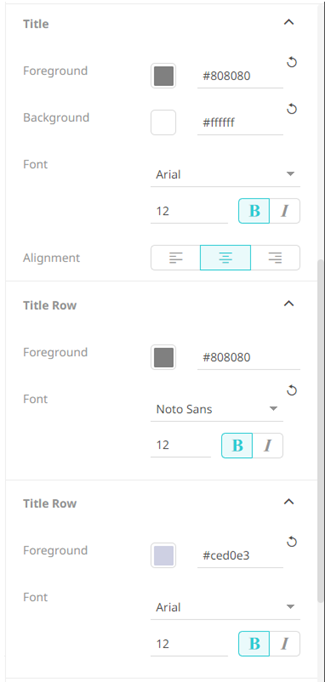
For each title row, a corresponding Title Row section is added in the Style pane.
- To set the style of the visualization title rows, click Style
 .
.
The page updates to display the Style pane.
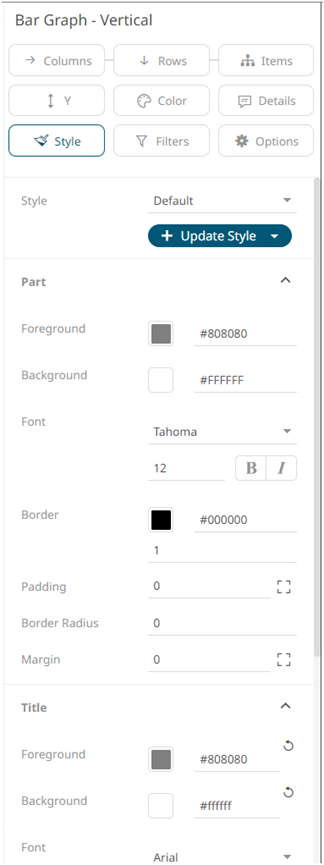
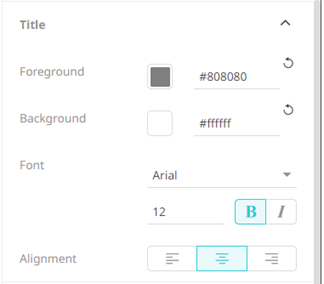
- For all title rows, set the Foreground, Background, Alignment, Font type, style, style (Bold and/or Italic) in the Title section.
- You can opt to set these properties for each row in the corresponding Title Row sections.
(c) 2013-2025 Altair Engineering Inc. All Rights Reserved.