Visualization Static Filter
You can define a filter to a visualization based on a specific subset of the available data.
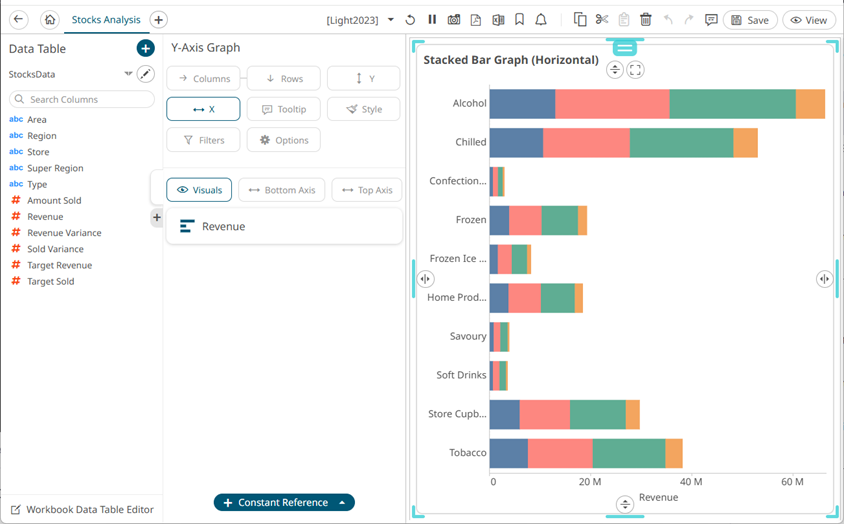
- Click on a visualization to display its Properties pane.
- To add to the filter, drag columns from the Data Table pane to the Filter drop area.
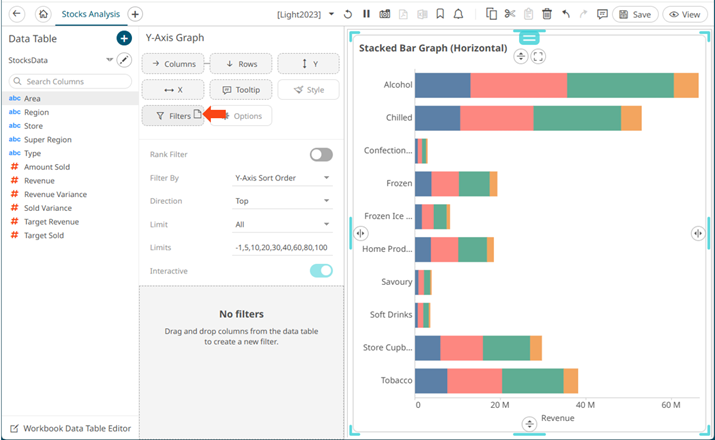
- The column is added, and the Visualization Settings pane changes to display the Filter properties.
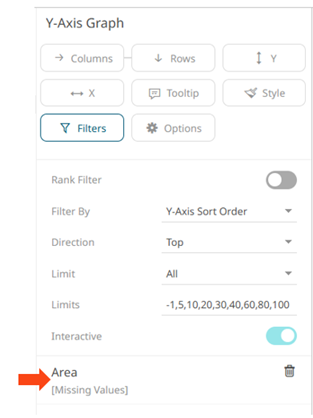
Initially, there are no values added for the filter column.
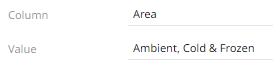
- Click on the filter column. The pane changes again.
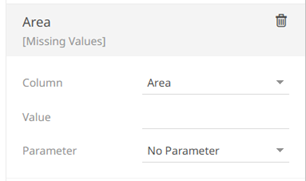
For text columns, enter the Value.
NOTE: You can add more than one value for a column. For example:
You can select a set dashboard parameter from the Parameter drop-down list.
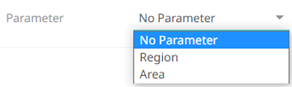
This will overwrite the entered filter values.
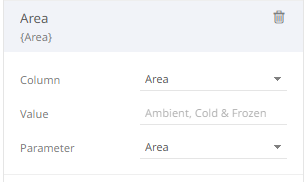
NOTE: The selected parameter must have values that are available on the filter column.
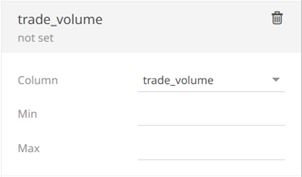
For numeric columns, enter the Min and Max values.
For time columns, enter the From and To values.
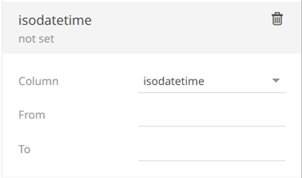
The visualization is updated based on the filter column values.
NOTE: Input values From and To for time columns and Min and Max for numeric columns can be parameterized.
- Drag and drop other text columns to add more filters.
- Click the Save
 icon on the toolbar.
(c) 2013-2025 Altair Engineering Inc. All Rights Reserved.