External Aggregates
Certain types of data that could not be aggregated by calculating a sum or an average are called non-additive data. There are also subadditive data which means that the aggregation of a group of several values could result in a value larger than any of the constituents that are part of the group, such as one plus two could equal to four. For such data, the group level values are found through more complex calculations. A well-known example is the calculation of Value at Risk (VaR) in capital markets. VaR is a measure of the risk of loss of investment, which takes many different parameters into account and is also calculated for a specified period. Calculating VaR requires specialised software—a Risk Engine—and can take considerable time to calculate.
Panopticon supports the use of externally provided aggregate values, such as VaR, which is calculated with a third-party software. When a data set contains external aggregate values, Panopticon will use those values instead of internally calculating the aggregate values.
In the example data set below, there are a couple of different asset classes in a few different geographic office locations as well as Exposure and VaR for two different time periods:
|
Region |
Country |
Office |
Asset Class |
Exposure |
10 VaR |
1 VaR |
|
North America |
Canada |
Toronto |
Commodities |
449.1171 |
83.4499 |
26.3047 |
|
North America |
Canada |
Toronto |
Equity |
909.3673 |
16.8531 |
30.2247 |
|
North America |
Canada |
Vancouver |
Commodities |
260.9837 |
10.9165 |
13.7078 |
|
North America |
Canada |
Vancouver |
Equity |
374.7892 |
14.2773 |
23.7829 |
|
North America |
USA |
Boston |
Equity |
502.5591 |
96.9313 |
34.3891 |
|
North America |
USA |
Boston |
Commodities |
305.9504 |
12.3754 |
3.2304 |
|
North America |
USA |
Chicago |
Equity |
652.1543 |
76.2075 |
11.7147 |
|
North America |
USA |
Chicago |
Commodities |
459.5511 |
33.4553 |
17.6896 |
To know the overall VaR for one of the asset classes, or the overall VaR for the entire region, they could not be calculated using the numbers in the table. Those aggregate values require a complex calculation that must be performed externally and supplied as part of the data set.
In the example below, a single row of external aggregate values has been added that apply to the whole Region. As a way of marking that those numbers are aggregate values, and not specific to any Country, any Office or any Asset Class, we have inserted a marker word in those columns, which is the word TOTAL. The marker word used does not matter. It can be chosen at will and the same marker word is then specified in the data table settings in Panopticon.
|
Region |
Country |
Office |
Asset Class |
Exposure |
10 VaR |
1 VaR |
|
North America |
Canada |
Toronto |
Commodities |
449.1171 |
83.4499 |
26.3047 |
|
North America |
Canada |
Toronto |
Equity |
909.3673 |
16.8531 |
30.2247 |
|
North America |
Canada |
Vancouver |
Commodities |
260.9837 |
10.9165 |
13.7078 |
|
North America |
Canada |
Vancouver |
Equity |
374.7892 |
14.2773 |
23.7829 |
|
North America |
USA |
Boston |
Equity |
502.5591 |
96.9313 |
34.3891 |
|
North America |
USA |
Boston |
Commodities |
305.9504 |
12.3754 |
3.2304 |
|
North America |
USA |
Chicago |
Equity |
652.1543 |
76.2075 |
11.7147 |
|
North America |
USA |
Chicago |
Commodities |
459.5511 |
33.4553 |
17.6896 |
|
North America |
TOTAL |
TOTAL |
TOTAL |
3914.472 |
54.2786 |
67.4829 |
With this data set, you can see the VaR for each specific combination of Region, Country, Office, and Asset Class, as well as the overall VaR for the whole Region. However, the data set does not specify the overall VaR for Canada, or the overall Commodities, among others.
To achieve this, the data set must be extended to contain one row for each aggregation that you are interested in. The result would look like this:
|
Region |
Country |
Office |
Asset Class |
Exposure |
10 VaR |
1 VaR |
|
North America |
Canada |
Toronto |
Commodities |
449.1171 |
83.4499 |
26.3047 |
|
North America |
Canada |
Toronto |
Equity |
909.3673 |
16.8531 |
30.2247 |
|
North America |
Canada |
Vancouver |
Commodities |
260.9837 |
10.9165 |
13.7078 |
|
North America |
Canada |
Vancouver |
Equity |
374.7892 |
14.2773 |
23.7829 |
|
North America |
USA |
Boston |
Equity |
502.5591 |
96.9313 |
34.3891 |
|
North America |
USA |
Boston |
Commodities |
305.9504 |
12.3754 |
3.2304 |
|
North America |
USA |
Chicago |
Equity |
652.1543 |
76.2075 |
11.7147 |
|
North America |
USA |
Chicago |
Commodities |
459.5511 |
33.4553 |
17.6896 |
|
North America |
Canada |
Toronto |
TOTAL |
1358.484 |
38.4462 |
22.0139 |
|
North America |
Canada |
Vancouver |
TOTAL |
635.7729 |
32.3003 |
30.2389 |
|
North America |
USA |
Boston |
TOTAL |
808.5095 |
99.7753 |
85.4723 |
|
North America |
USA |
Chicago |
TOTAL |
1111.705 |
62.5171 |
48.0544 |
|
North America |
Canada |
TOTAL |
TOTAL |
1994.257 |
42.782 |
39.2778 |
|
North America |
USA |
TOTAL |
TOTAL |
1920.215 |
18.7829 |
44.9223 |
|
North America |
Canada |
TOTAL |
Commodities |
710.1008 |
28.8047 |
31.1579 |
|
North America |
Canada |
TOTAL |
Equity |
1284.157 |
55.2736 |
71.5806 |
|
North America |
USA |
TOTAL |
Commodities |
765.5015 |
80.6778 |
30.9781 |
|
North America |
USA |
TOTAL |
Equity |
1154.713 |
76.8432 |
20.9828 |
|
North America |
TOTAL |
TOTAL |
Equity |
2438.87 |
96.4873 |
26.3088 |
|
North America |
TOTAL |
TOTAL |
Commodities |
1475.602 |
93.0813 |
78.5314 |
|
North America |
TOTAL |
TOTAL |
TOTAL |
3914.472 |
54.2786 |
67.4829 |
|
TOTAL |
TOTAL |
TOTAL |
Commodities |
1475.602 |
93.0813 |
78.5314 |
|
TOTAL |
TOTAL |
TOTAL |
Equity |
2438.87 |
96.4873 |
26.3088 |
|
TOTAL |
TOTAL |
TOTAL |
TOTAL |
3914.472 |
54.2786 |
67.4829 |
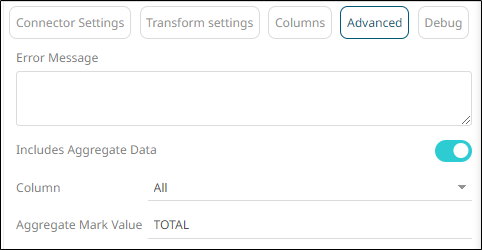
With this data set, you can create a data table in Panopticon and specify that the data Includes Aggregate Data under the Advanced settings pill. You can specify that the columns are All, and the chosen Aggregate Mark Value which in this case is TOTAL.
NOTE: The option of selecting a specific column name instead of selecting All is available for legacy reasons but is not recommended. Please see the documentation of previous release versions (< 2025.1) for usage instructions.
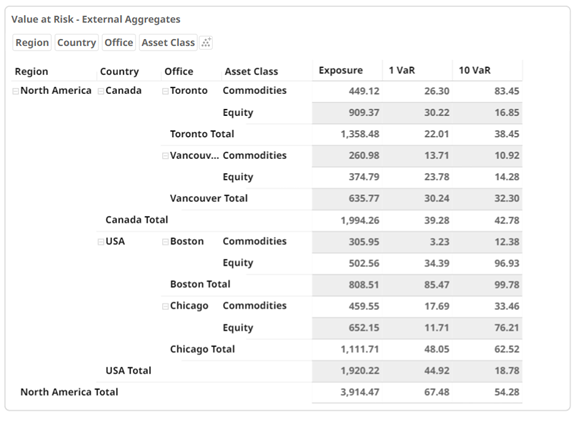
You can now use the data table and build a visualization where there are aggregated VaR values at several relevant breakdowns: You can put Asset Class in any order position among the geographically oriented columns, for example:
Region, Country, Office, Asset Class
Region, Country, Asset Class, Office
Region, Asset Class, Country, Office
Asset Class, Region, Country, Office
You can also use any of the hierarchies above with reduced detail, such as:
Region, Country, Office, Asset Class
Region, Country, Asset Class, Office
Region, Country, Asset Class, Office
Asset Class, Region, Country, Office
Region, Country, Office, Asset Class
However, there are no rows available in the example data set that define the aggregate values for any breakdown that skips some parts of the hierarchy, such as [Asset Class, Office] or [Country, Asset Class] or [Region, Office]. To support displaying any combination of any category columns, additional rows of aggregate values are required.
A data set that supports any combination of category columns for this example data would look like the one below, where external aggregate rows for each combination of category columns are defined. From the four category columns and eight unique, valid category value combinations, you need no less than 58 additional rows that aggregate values for all combinations of one, several or, all the category columns. Even though this example contains just one value for region, you still need a row marked TOTAL in the Region column for each case where you want to ignore the Region column. Furthermore, even though each Office is in just one Country, you still need a row marked TOTAL in the Country column for each case where you want to ignore the Country column, etc.
|
Region |
Country |
Office |
Asset Class |
Exposure |
10 VaR |
1 VaR |
|
North America |
Canada |
Toronto |
Commodities |
449.1171 |
83.4499 |
26.3047 |
|
North America |
Canada |
Toronto |
Equity |
909.3673 |
16.8531 |
30.2247 |
|
North America |
Canada |
Vancouver |
Commodities |
260.9837 |
10.9165 |
13.7078 |
|
North America |
Canada |
Vancouver |
Equity |
374.7892 |
14.2773 |
23.7829 |
|
North America |
USA |
Boston |
Equity |
502.5591 |
96.9313 |
34.3891 |
|
North America |
USA |
Boston |
Commodities |
305.9504 |
12.3754 |
3.2304 |
|
North America |
USA |
Chicago |
Equity |
652.1543 |
76.2075 |
11.7147 |
|
North America |
USA |
Chicago |
Commodities |
459.5511 |
33.4553 |
17.6896 |
|
North America |
Canada |
Toronto |
TOTAL |
1358.484 |
38.4462 |
22.0139 |
|
North America |
Canada |
Vancouver |
TOTAL |
635.7729 |
32.3003 |
30.2389 |
|
North America |
USA |
Boston |
TOTAL |
808.5095 |
99.7753 |
85.4723 |
|
North America |
USA |
Chicago |
TOTAL |
1111.705 |
62.5171 |
48.0544 |
|
North America |
Canada |
TOTAL |
Commodities |
710.1008 |
28.8047 |
31.1579 |
|
North America |
Canada |
TOTAL |
Equity |
1284.157 |
55.2736 |
71.5806 |
|
North America |
USA |
TOTAL |
Commodities |
765.5015 |
80.6778 |
30.9781 |
|
North America |
USA |
TOTAL |
Equity |
1154.713 |
76.8432 |
20.9828 |
|
North America |
TOTAL |
Toronto |
Commodities |
449.1171 |
83.4499 |
26.3047 |
|
North America |
TOTAL |
Toronto |
Equity |
909.3673 |
16.8531 |
30.2247 |
|
North America |
TOTAL |
Vancouver |
Commodities |
260.9837 |
10.9165 |
13.7078 |
|
North America |
TOTAL |
Vancouver |
Equity |
374.7892 |
14.2773 |
23.7829 |
|
North America |
TOTAL |
Boston |
Equity |
502.5591 |
96.9313 |
34.3891 |
|
North America |
TOTAL |
Boston |
Commodities |
305.9504 |
12.3754 |
3.2304 |
|
North America |
TOTAL |
Chicago |
Equity |
652.1543 |
76.2075 |
11.7147 |
|
North America |
TOTAL |
Chicago |
Commodities |
459.5511 |
33.4553 |
17.6896 |
|
TOTAL |
Canada |
Toronto |
Commodities |
449.1171 |
83.4499 |
26.3047 |
|
TOTAL |
Canada |
Toronto |
Equity |
909.3673 |
16.8531 |
30.2247 |
|
TOTAL |
Canada |
Vancouver |
Commodities |
260.9837 |
10.9165 |
13.7078 |
|
TOTAL |
Canada |
Vancouver |
Equity |
374.7892 |
14.2773 |
23.7829 |
|
TOTAL |
USA |
Boston |
Equity |
502.5591 |
96.9313 |
34.3891 |
|
TOTAL |
USA |
Boston |
Commodities |
305.9504 |
12.3754 |
3.2304 |
|
TOTAL |
USA |
Chicago |
Equity |
652.1543 |
76.2075 |
11.7147 |
|
TOTAL |
USA |
Chicago |
Commodities |
459.5511 |
33.4553 |
17.6896 |
|
North America |
Canada |
TOTAL |
TOTAL |
1994.257 |
42.782 |
39.2778 |
|
North America |
USA |
TOTAL |
TOTAL |
1920.215 |
18.7829 |
44.9223 |
|
North America |
TOTAL |
Toronto |
TOTAL |
1358.484 |
38.4462 |
22.0139 |
|
North America |
TOTAL |
Vancouver |
TOTAL |
635.7729 |
32.3003 |
30.2389 |
|
North America |
TOTAL |
Boston |
TOTAL |
808.5095 |
99.7753 |
85.4723 |
|
North America |
TOTAL |
Chicago |
TOTAL |
1111.705 |
62.5171 |
48.0544 |
|
TOTAL |
Canada |
Toronto |
TOTAL |
1358.484 |
38.4462 |
22.0139 |
|
TOTAL |
Canada |
Vancouver |
TOTAL |
635.7729 |
32.3003 |
30.2389 |
|
TOTAL |
USA |
Boston |
TOTAL |
808.5095 |
99.7753 |
85.4723 |
|
TOTAL |
USA |
Chicago |
TOTAL |
1111.705 |
62.5171 |
48.0544 |
|
North America |
TOTAL |
TOTAL |
Equity |
2438.87 |
96.4873 |
26.3088 |
|
North America |
TOTAL |
TOTAL |
Commodities |
1475.602 |
93.0813 |
78.5314 |
|
TOTAL |
Canada |
TOTAL |
Commodities |
710.1008 |
28.8047 |
31.1579 |
|
TOTAL |
Canada |
TOTAL |
Equity |
1284.157 |
55.2736 |
71.5806 |
|
TOTAL |
USA |
TOTAL |
Commodities |
765.5015 |
80.6778 |
30.9781 |
|
TOTAL |
USA |
TOTAL |
Equity |
1154.713 |
76.8432 |
20.9828 |
|
TOTAL |
TOTAL |
Toronto |
Commodities |
449.1171 |
83.4499 |
26.3047 |
|
TOTAL |
TOTAL |
Toronto |
Equity |
909.3673 |
16.8531 |
30.2247 |
|
TOTAL |
TOTAL |
Vancouver |
Commodities |
260.9837 |
10.9165 |
13.7078 |
|
TOTAL |
TOTAL |
Vancouver |
Equity |
374.7892 |
14.2773 |
23.7829 |
|
TOTAL |
TOTAL |
Boston |
Equity |
502.5591 |
96.9313 |
34.3891 |
|
TOTAL |
TOTAL |
Boston |
Commodities |
305.9504 |
12.3754 |
3.2304 |
|
TOTAL |
TOTAL |
Chicago |
Equity |
652.1543 |
76.2075 |
11.7147 |
|
TOTAL |
TOTAL |
Chicago |
Commodities |
459.5511 |
33.4553 |
17.6896 |
|
TOTAL |
TOTAL |
TOTAL |
Commodities |
1475.602 |
93.0813 |
78.5314 |
|
TOTAL |
TOTAL |
TOTAL |
Equity |
2438.87 |
96.4873 |
26.3088 |
|
TOTAL |
TOTAL |
Toronto |
TOTAL |
1358.484 |
38.4462 |
22.0139 |
|
TOTAL |
TOTAL |
Vancouver |
TOTAL |
635.7729 |
32.3003 |
30.2389 |
|
TOTAL |
TOTAL |
Boston |
TOTAL |
808.5095 |
99.7753 |
85.4723 |
|
TOTAL |
TOTAL |
Chicago |
TOTAL |
1111.705 |
62.5171 |
48.0544 |
|
TOTAL |
Canada |
TOTAL |
TOTAL |
1994.257 |
42.782 |
39.2778 |
|
TOTAL |
USA |
TOTAL |
TOTAL |
1920.215 |
18.7829 |
44.9223 |
|
North America |
TOTAL |
TOTAL |
TOTAL |
3914.472 |
54.2786 |
67.4829 |
|
TOTAL |
TOTAL |
TOTAL |
TOTAL |
3914.472 |
54.2786 |
67.4829 |
With the data set with external aggregate values included for each possible category column combination, you can freely use the dynamic slicing and dicing functionality in Panopticon, where the Breakdown Control widget allows the user to reorganize columns at will, as well as include and exclude them as needed.
(c) 2013-2024 Altair Engineering Inc. All Rights Reserved.